It has been some time since posting here. I thought that this would be a great topic to pick things up again and share some insight on how one goes about taking advantage of this capability when considering monitoring and troubleshooting NSX Security traffic flow.
When I meet with customers discussing NSX Security capabilities an important topic of discussion that is always top of mind is Operations. These usually would include the need to have visibility of traffic flows, logging, port mirroring or packet captures for further analysis.
Over the years we figured out how to use all these tools when all our security capabilities were realized in physical appliances and customers expect to have the same or even better operational tools when considering a software-only solution from NSX Security.
Today, NSX 4.1.0 provides some out-of-the-box Network Monitoring tools
- IPFix Export
- Port Mirror
- TraceFlow
- SNMP
- Network Latency Statistics
- Live Traffic Analysis
I am going to focus on NSX Live Traffic Analysis (LTA) and try and provide some insight too how one goes about using NSX LTA for Network Monitoring, Troubleshooting.
NSX Live Traffic Analysis Overview
As per the VMware description of NSX Live Traffic Analysis (LTA)
“Live Traffic Analysis (LTA) provides helpful insight about tracing live traffic and bi-directional packet tracing. Traffic analysis monitors live traffic at a source or between source and destination along with the packet capture. You can identify bad flows between the source and the destination. If the packet counter of the certain flow at the source endpoint is much higher than the packet counter of the certain flow at the destination endpoint, packet drop may occur between two endpoints. Hence the flow is probably a bad flow which you can trace for further analysis. Thus traffic analysis is helpful in troubleshooting virtual network issues. You can find the number of packet enter or leave a port, and the unexpected packet drop.”
Let’s start with what you need to know upfront before diving into using LTA.
Requirements
LTA was introduced in NSX 3.1.0 and the feature is available in all NSX licensing offers, with the exception of NSX Firewall for Baremetal Servers.
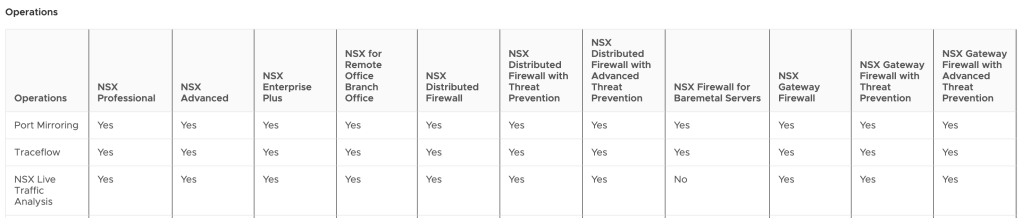
For the full detailed list of NSX features to license mapping visit this link NSX Features. Be sure to focus on the correct NSX version which you have deployed.
There is no dedicated installation process required for LTA, once you have the NSX Manager deployed, you have LTA available. But do take note of the limitations below.
Limitations
These are the current limitations as per NSX 4.1.0 documentation, these may change in future releases.
- LTA supports only on the overlay-backed NSX environments.
- LTA with packet capture is not supported on Edge interfaces.
- LTA is not supported on T0 Active/Active setup.
- LTA is not supported on Global Manager.
- LTA cannot observe VMC components that do not belong to the NSX management domain, such as IGW.
Let’s get Started
Where do I find LTA in the NSX dashboard??
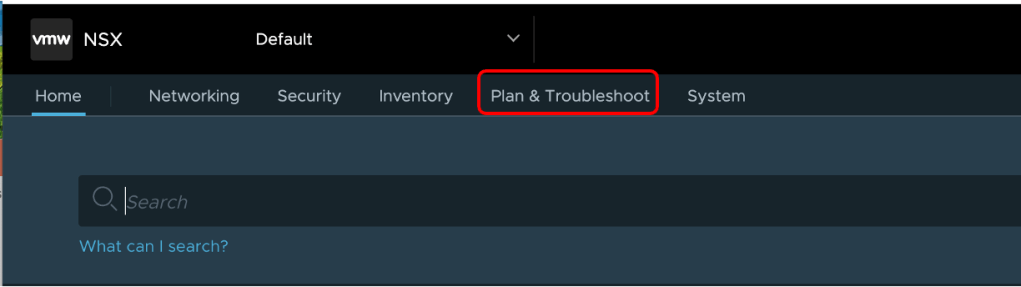
Step 1 – At the top of the NSX Dashboard select Plan & Troubleshoot
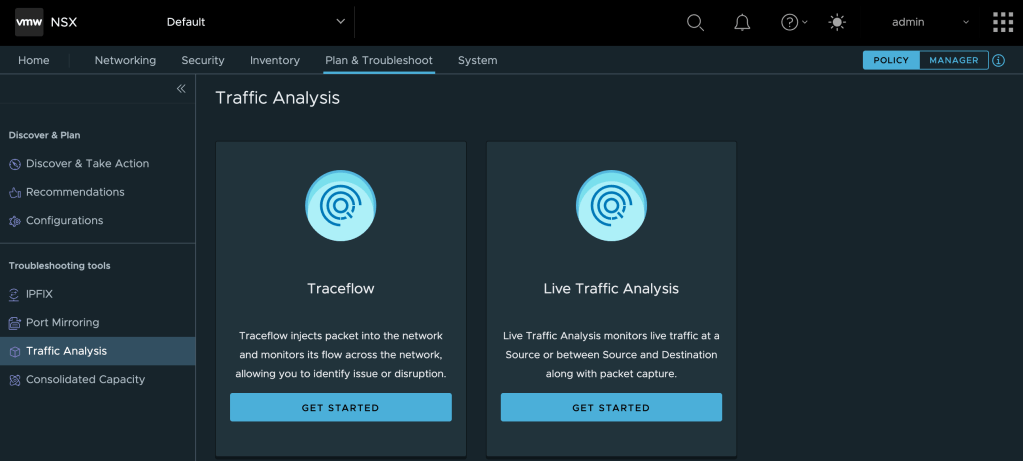
Step 2 – Select Traffic Analysis from the lefthand column.
Your view might differ from mine as I have NSX Intelligence installed in this environment but you will still see the Traffic Analysis in the menu.

Step 3 – Select Get Started on the right under Live Traffic Analysis
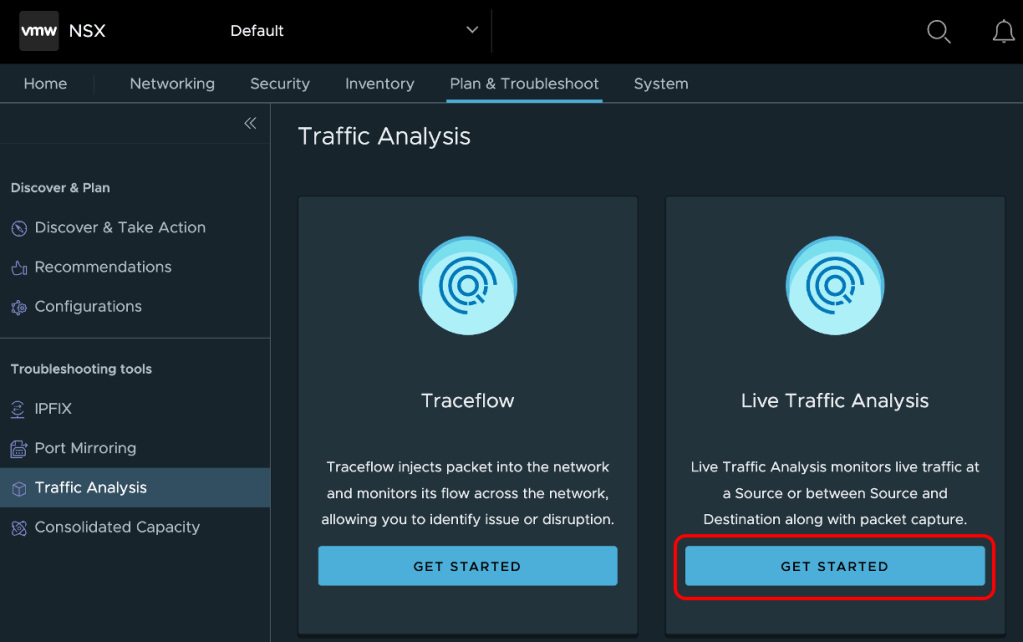
You should see the Live Traffic Analysis page as shown below.
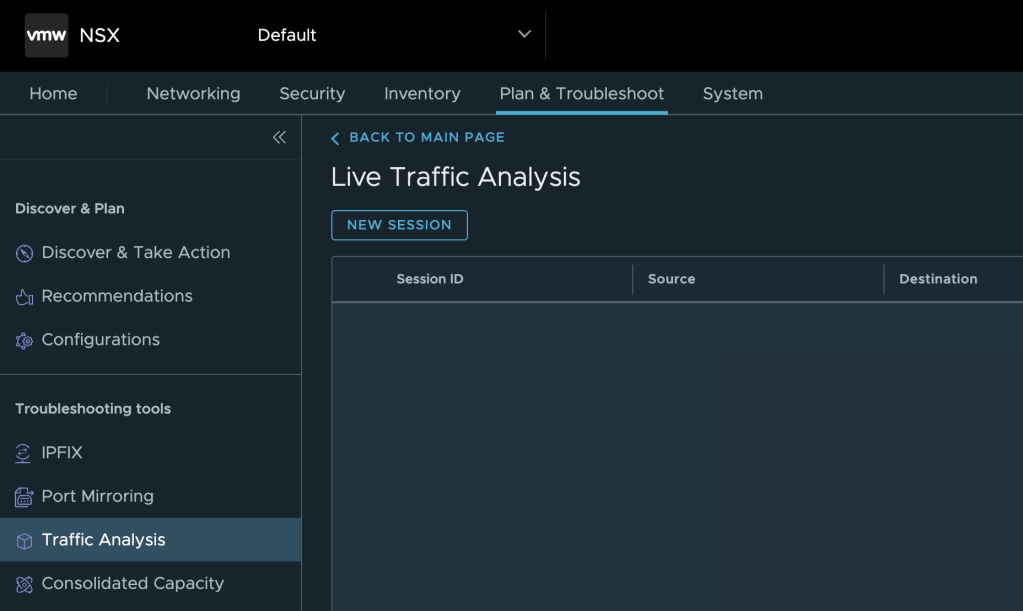
Let’s create our first Session
NSX LTA allows you to create a session to monitor the Live Traffic for one or two VM’s. So you can create a session that only has one workload which you want to monitor or you can select two workloads and monitor the traffic between these two workloads.
We will start with monitoring traffic on a single VM.
Step 1 – Select New Session under Live Traffic Analysis
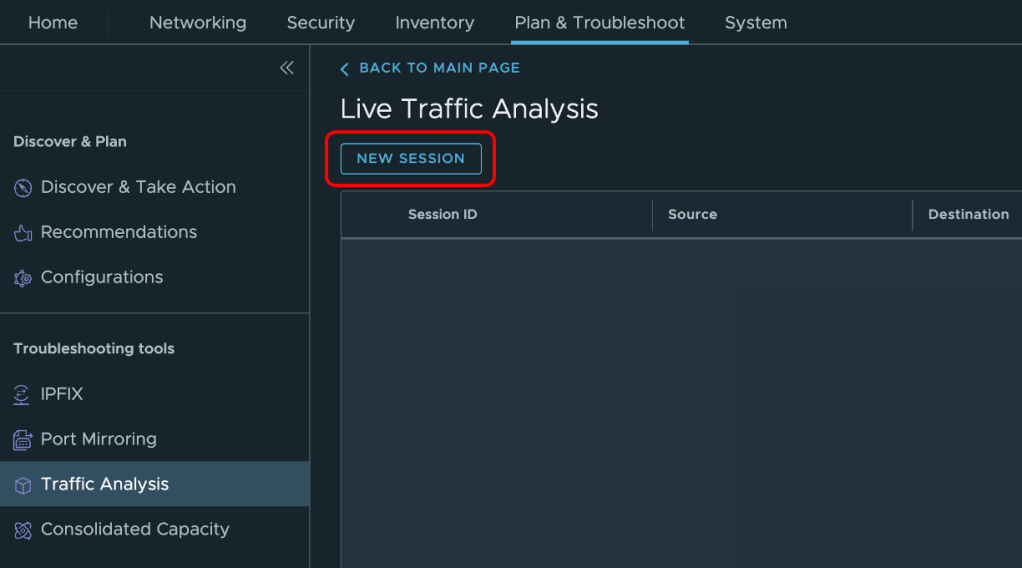
LTA provides a number of options and you will quickly see this once you have opened the UI to create your first session.
Step 2 – Select the options below under Live Traffic Analysis
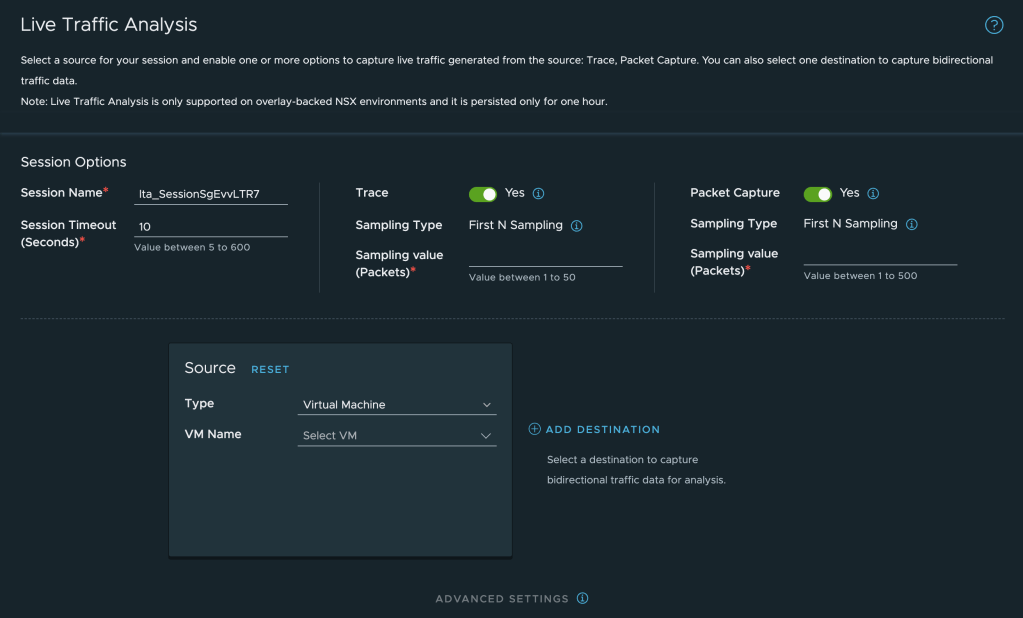
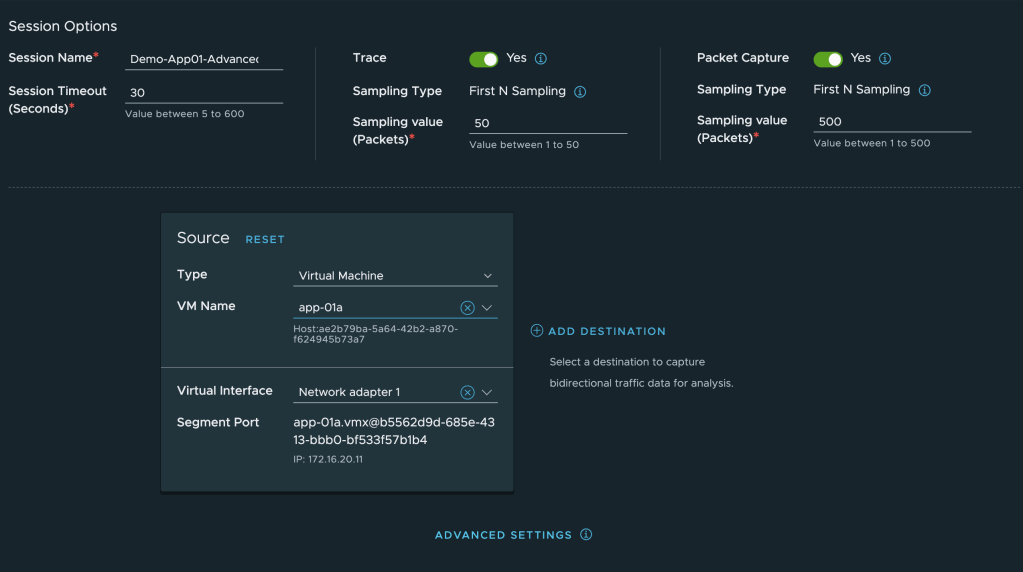
Session Options
- Session Name = Enter a descriptive name here or the system will create a random name for you.
- Session Timeout (Seconds) = Default timeout value is 10 seconds. You can add value between 5 to 300 seconds. This determines how long this session will capture traffic. If you leave it to the default setting, it will capture 10 seconds worth of traffic or you can configure it to run the capture for a maximum of 300 seconds or 5 minutes.
- Trace (Yes) = By default, the toggle is active. Trace generates the packet traceflow. If you select only the source, system generates the traceflow for the packets ingressed from the source (matching the forward filter, if any). If you also select the destination, in addition system generates the traceflow for the packets ingressed from the destination (matching the reverse filter, if any).
- Sampling Values (Packets) = First N number of packets that match the packet filter under the Advanced Settings tab are sampled for analysis. The default filter under the advanced settings matches all traffic. If you only select 1 one here, only the first packet is sampled/captured, so I am going to set this to the maximum configurable value – 50.
- Packet Capture (Yes) = Generates the PCAP files with live trace telemetry. By default, the toggle is active. If you want to have the option to download a PCAP file to be used for further analysis using a tool like Wireshark, then leave this option default to Active.
- Sampling Value (Packets) = Enter the value from 1 through 500. Again, if you set this to one, you will only see the first packet that matches the filter – the default filter matches all IPv4 traffic. So if you have not defined an advanced filter, then set this to the maximum value of 500 if you intended to see more than one packet 🙂
- Source = Here we need to select the source which we intend to monitor – since we are only going to monitor a single VM initially only select one VM under source.
- Type = You can select a VM here or a port/interface
- Virtual Machine, select the VM in the drop menu
- If the VM has multiple vNICs, select the correct vNIC else you can leave it to the default selected vNIC
- Port/Interface (If you wanted to monitor a Port/Interface instead of a VM) You have the following options
- Select an attachment type – Virtual Interface, Edge Uplink, or Edge Centralized Service.
- Virtual Machine, select the VM in the drop menu
- Type = You can select a VM here or a port/interface
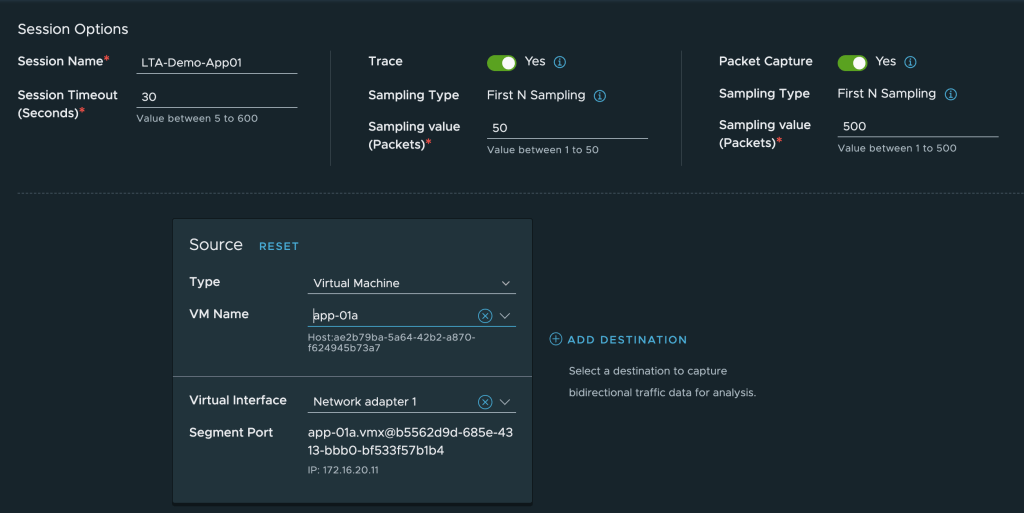
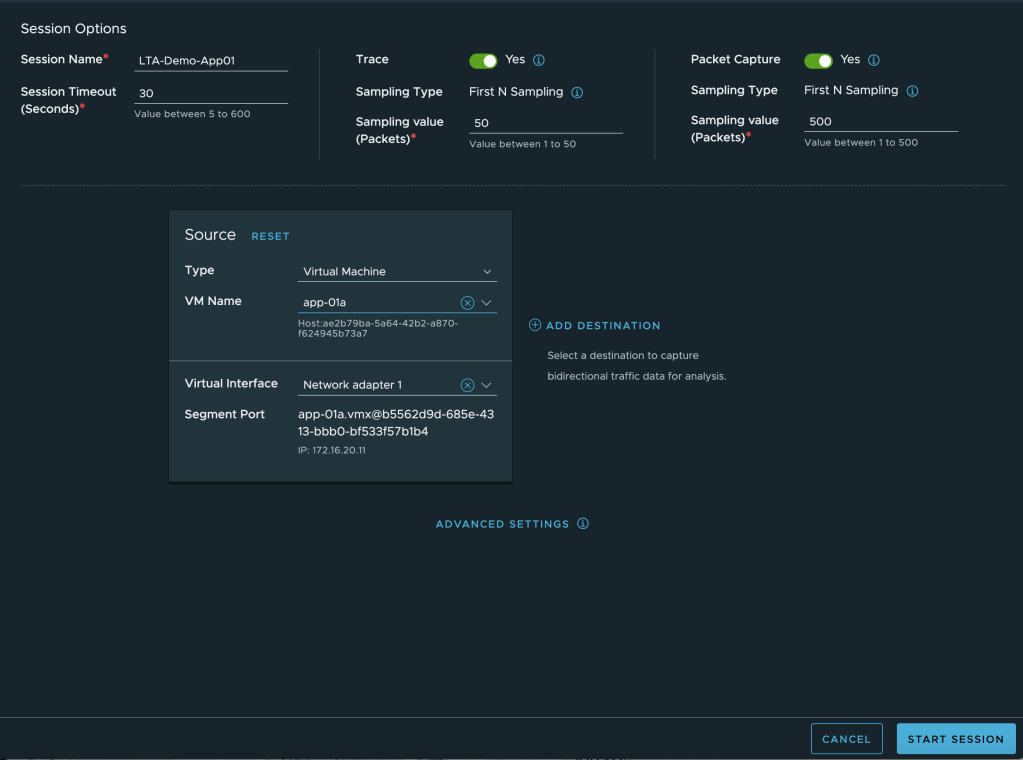
My First LTA Session settings are shown above.
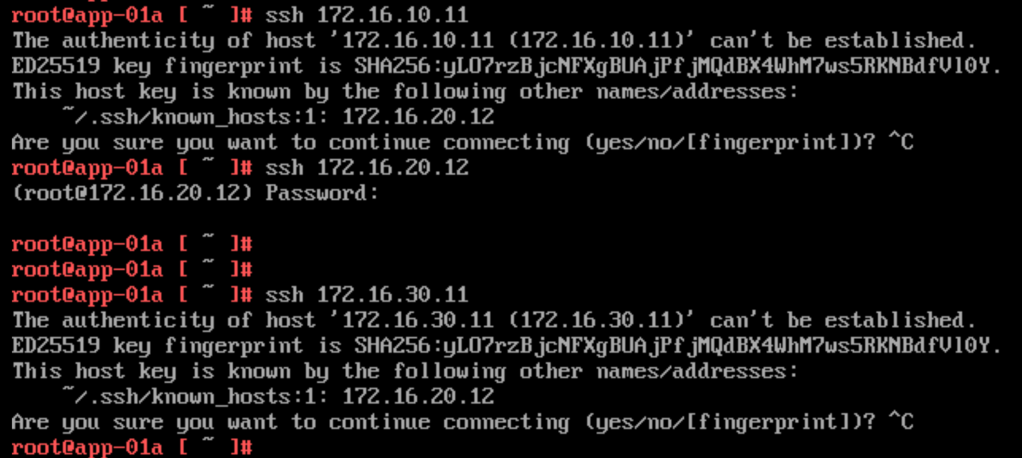
I am planning to run the monitor session for 30 seconds. I am going to monitor the traffic sourced from my App01 (172.16.20.11) to some other VM’s in my environment. I will do an ssh connection from App01 to App02 (172.16.20.12), DB01 (172.16.30.11) and Web01 (172.16.10.11). ***Take Note, my distribute Firewall is currently allowing all communication between these VMs.
Now to kickstart the session capture, click Start Session at the bottom right.
This is the traffic generated from App01

Let’s see the output of our first session
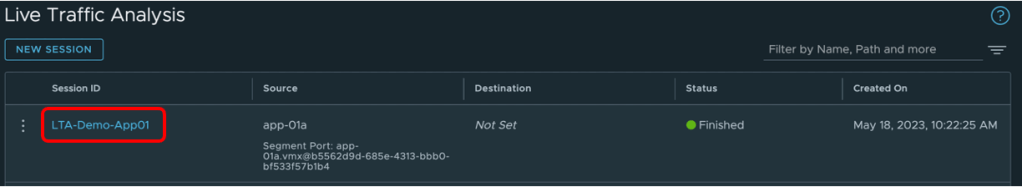
You should see your session status = Finished as shown below.
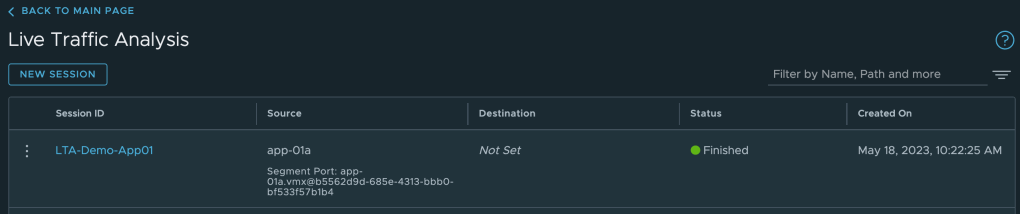
Click on your Session ID to open the results
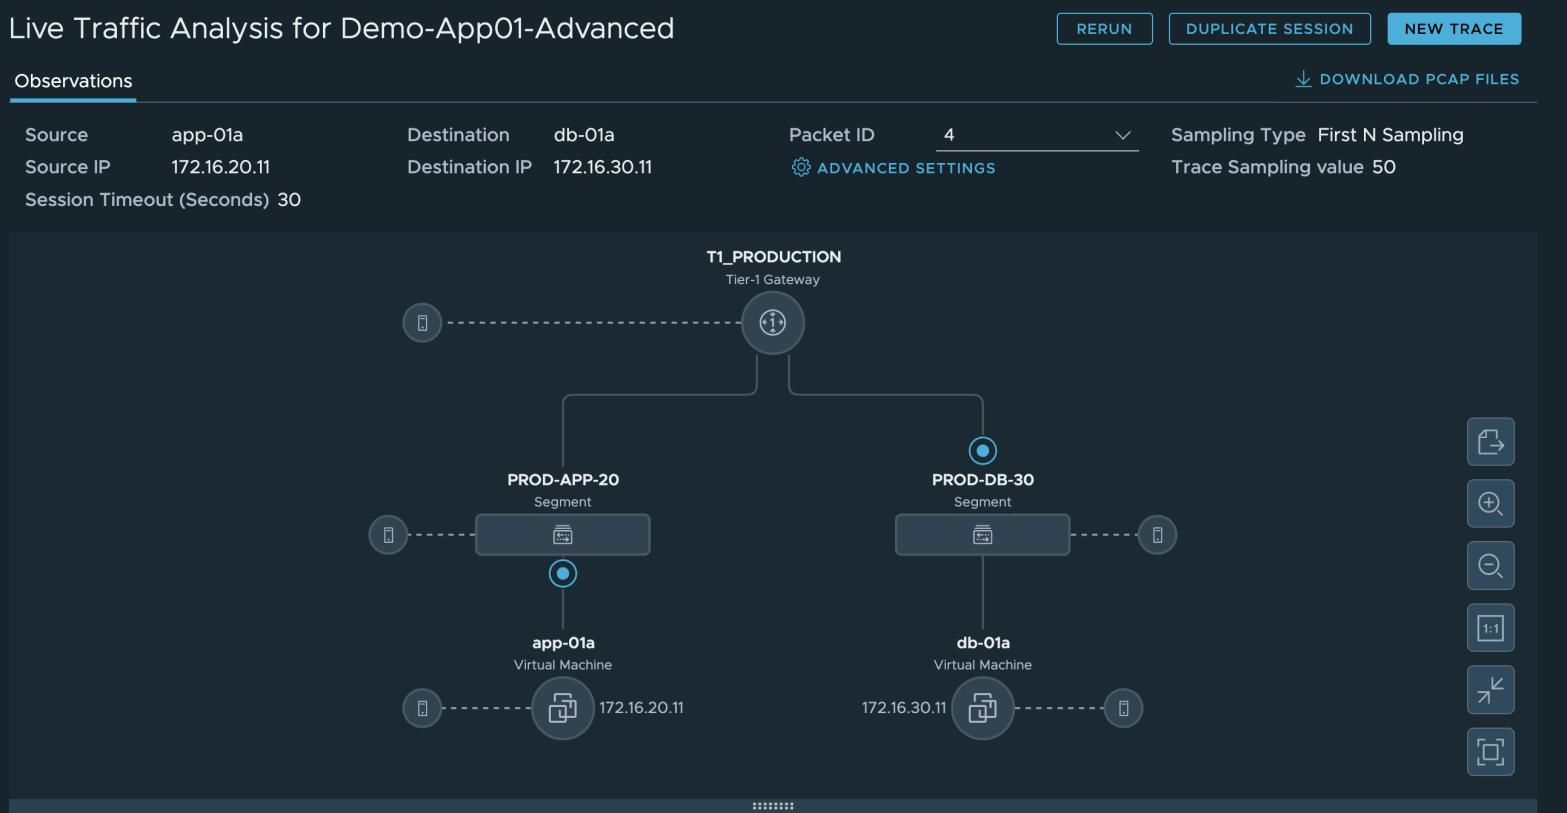
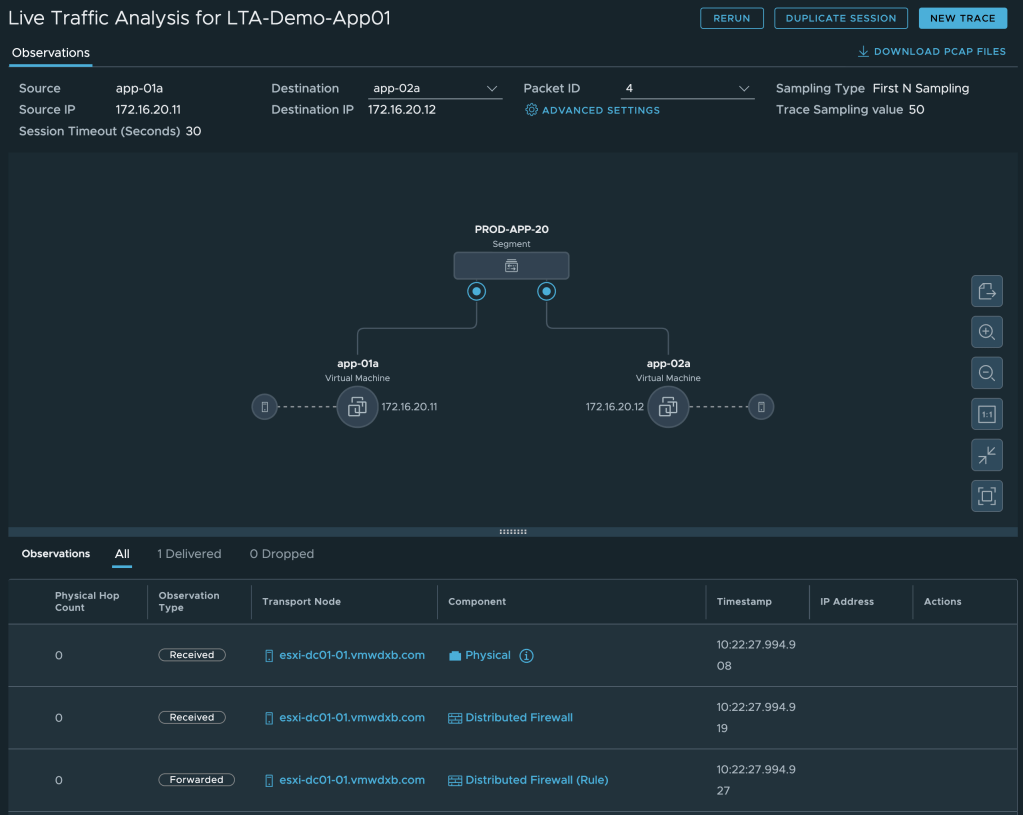
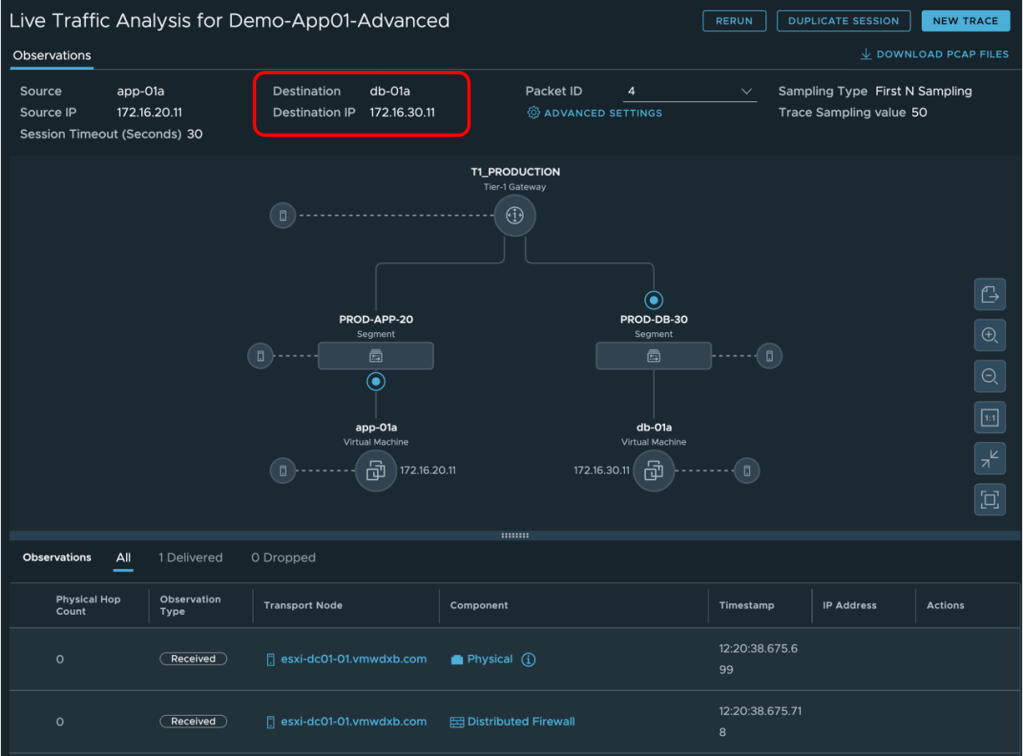
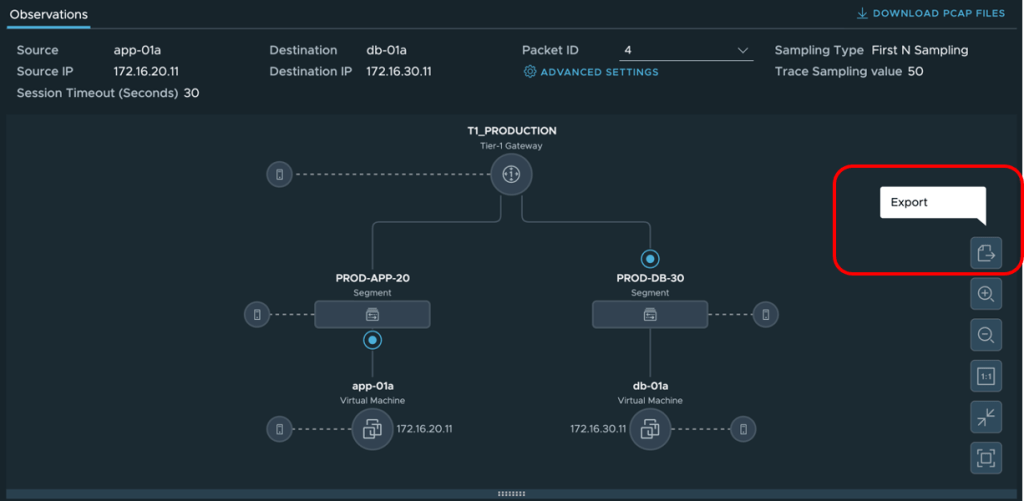
You should see the traffic which was generated while running the LTA session, in my case I do see the connection from App01 to App02 which was my first SSH session. You see the Traceflow topology generated and traffic observed hop by hop in your environment.
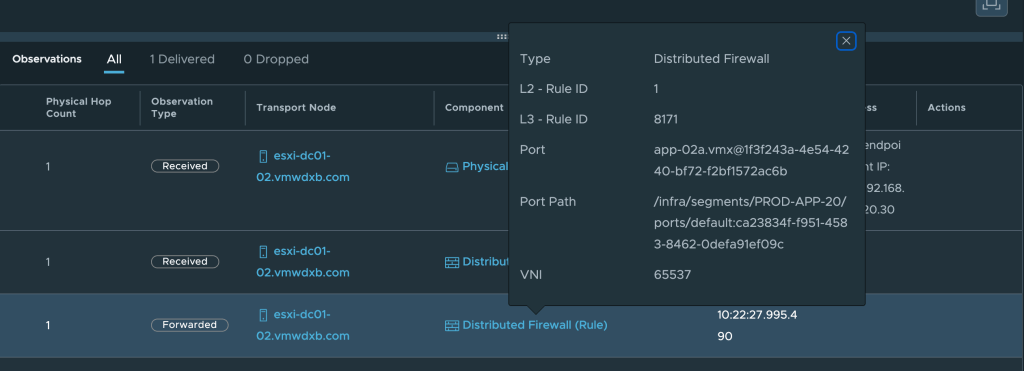
Click around on the observations and click on the components and view the various outputs.
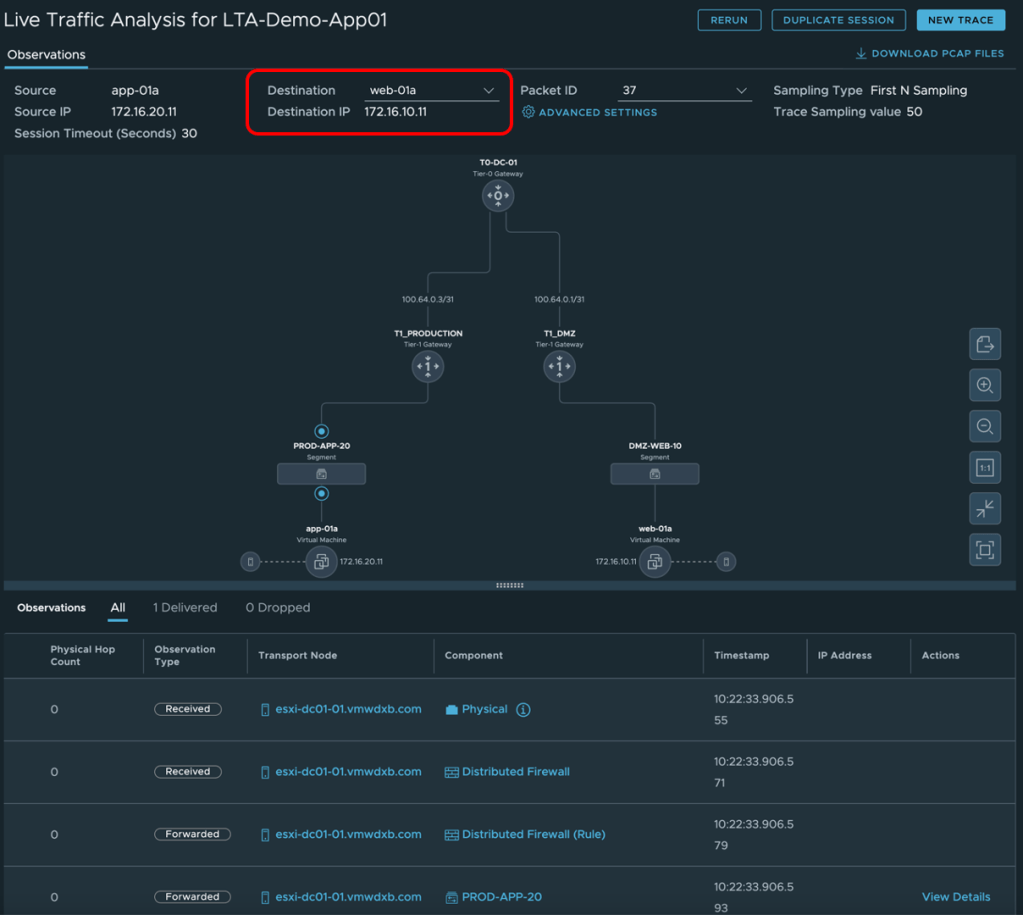
If you have generated traffic to more than one destination, you will see an option in the destination drop menu to select these. Below I have selected my Web-01a VM and you can see that the Traceflow topology is updated too – These two VMs are connected to different T1’s as seen below.
Download the Packet Capture
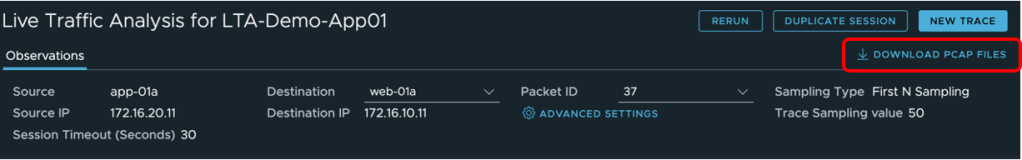
You also have the option to download a PCAP file of the packets captured in this session.
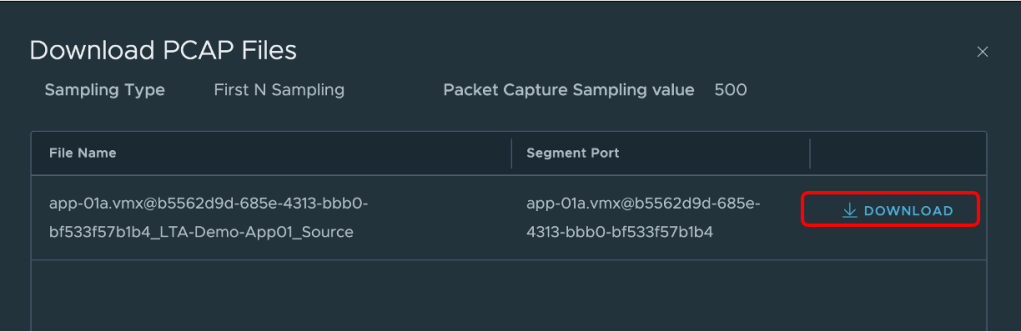
While keeping the session open, you see on the right-hand side “DOWNLOAD PCAP FILES” click this
Now on the window that opens select Download – select the destination on your local machine where to download and save the PCAP file too.
Once you have the file download to your local desktop or machine where you have Wireshark running, you can now open the file for detailed analysis.
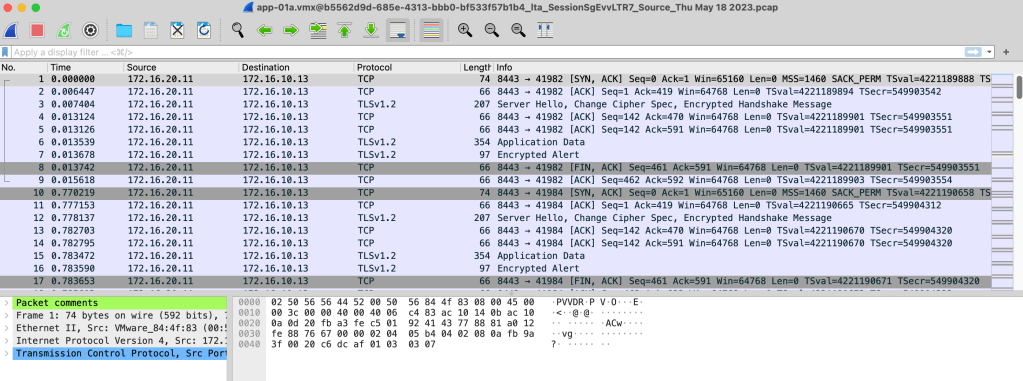
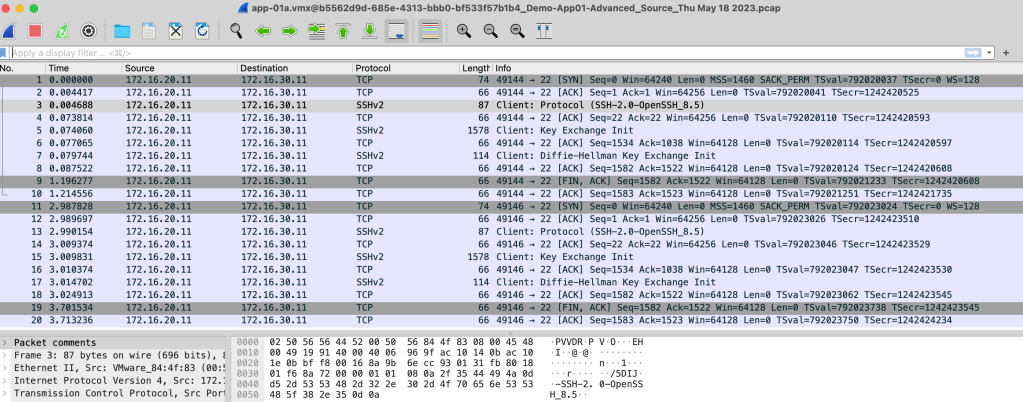
Let me set a filter on the traffic in Wireshark so that I only see SSH traffic
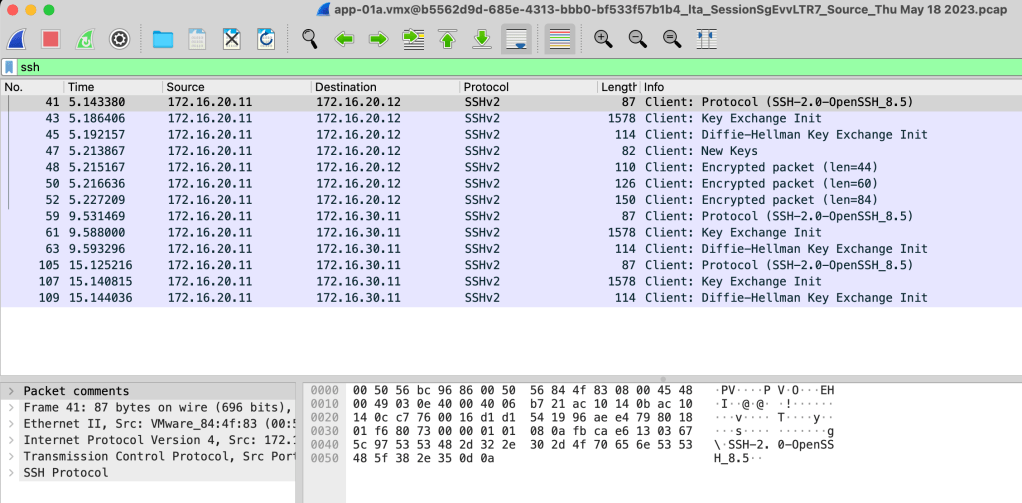
Here we can see the SSH connection from 172.16.20.11 to 172.16.20.12 and 172.16.30.11
Advanced Settings
Now let’s see what we can do using the advanced settings when creating the session.
I am going to create a new session with the same parameters as our previous example – just changing the name – and I will open the advanced settings tab at the bottom.
The default filter is set for all IPv4 forwarded traffic.
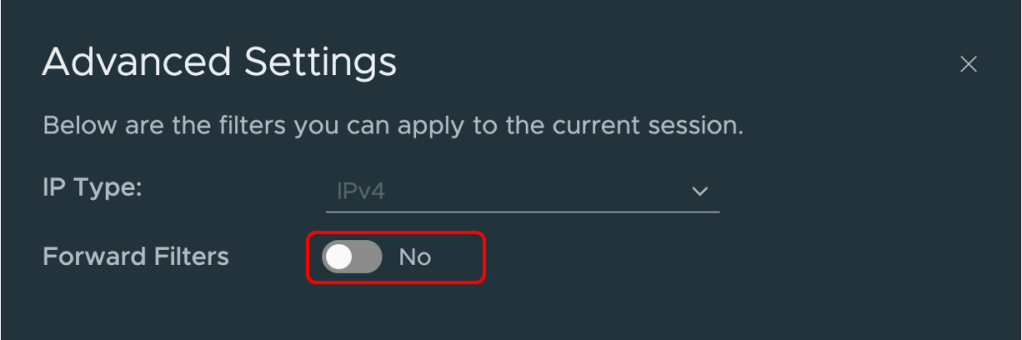
Click on the sliding option Forward Filters and you are presented with a list of options to create a custom filter on the captured traffic so that you could potentially focus on specific traffic or connections.
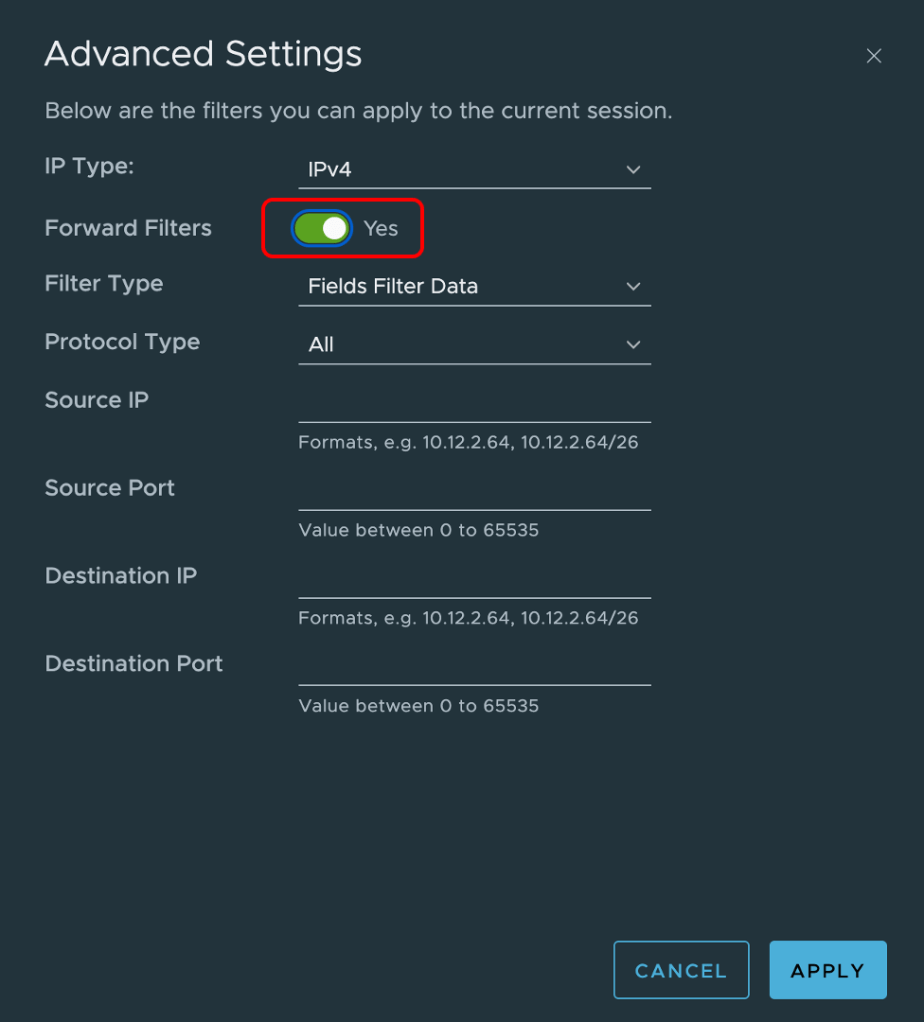
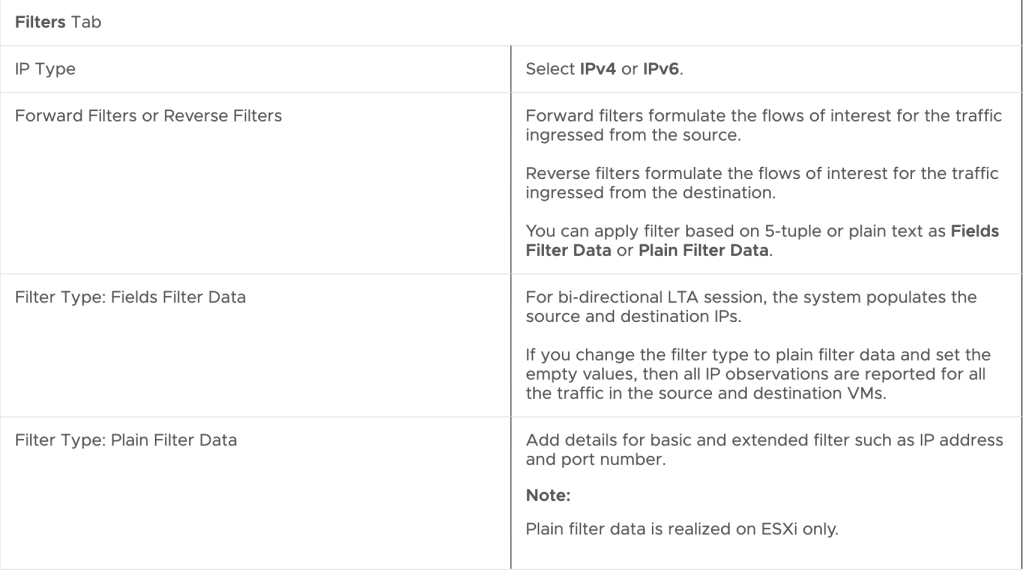
The filter values and options and summarized here:
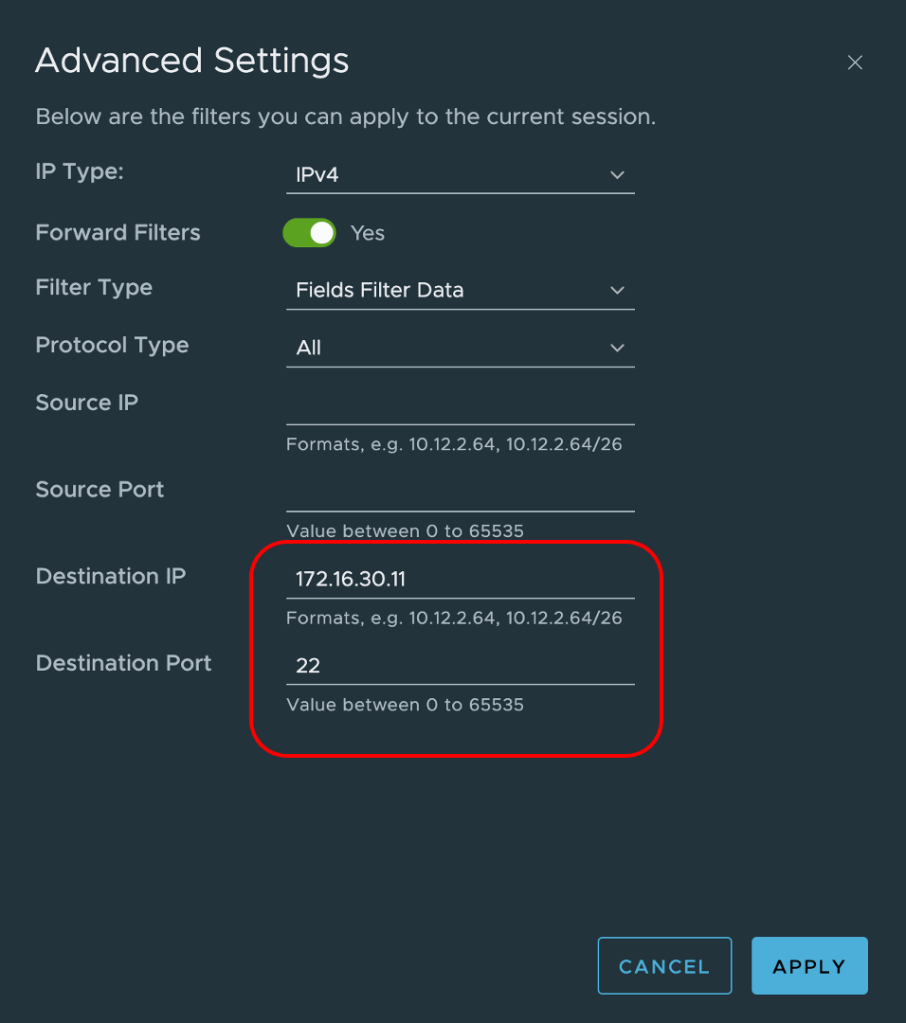
As an example, I will create a Filter matching the destination IP 172.16.30.11 and port 22 and click Apply
I have generated some traffic from App01 to Web01, App02 and DB01 as shown below
Once the Advanced LTA session completes, I opened the session as before by clicking on the session name. The output is now filtered to only show my traffic matching my filter. There is no drop menu in the destination matching Web01 or App02.
Now I downloaded the PCAP file created for this session and opened this in Wireshark. You see from the output below without any filter set, we only see traffic with a destination matching the filter set (172.16.30.11 and port 22)
Some other options
If you wish to rerun the capture without having to recreate all the settings, click on those 3 dots next to the session name and just click Rerun
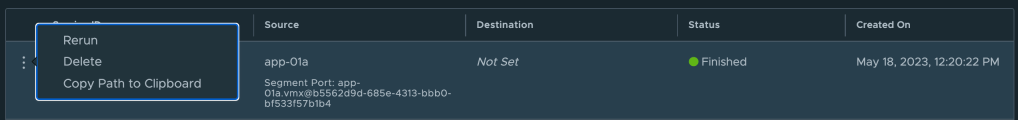
If you want to export the topology shown in the capture session – click the Export option on the right-hand side.
Summary
The intention of doing this blog was to provide some visibility of one of the monitoring tools which is natively available in NSX and mostly overlooked.
It definitely helped me to better understand the capabilities and how to use the tool effectively.
