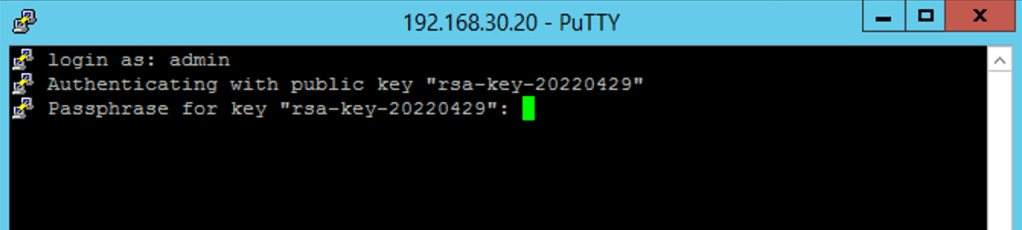
Wow!!! Time has passed, and so much has changed since my last post here!!
Broadcom acquired VMware, product offerings changed, names have changed, and so many new features and capabilities have been introduced.
VMware NSX Security has been rebranded to VMware vDefend, and license packages have been simplified.
Security Services Platform (SSP) was recently introduced; this platform will be replacing NSX Application Platform (NAPP). The deployment process is much simpler and provides a base platform for upcoming features and capabilities. Expect to see some “how-to” to blog posts on this shortly.
It has been some time since posting here. I thought that this would be a great topic to pick things up again and share some insight on how one goes about taking advantage of this capability when considering monitoring and troubleshooting NSX Security traffic flow.
When I meet with customers discussing NSX Security capabilities an important topic of discussion that is always top of mind is Operations. These usually would include the need to have visibility of traffic flows, logging, port mirroring or packet captures for further analysis.
Over the years we figured out how to use all these tools when all our security capabilities were realized in physical appliances and customers expect to have the same or even better operational tools when considering a software-only solution from NSX Security.
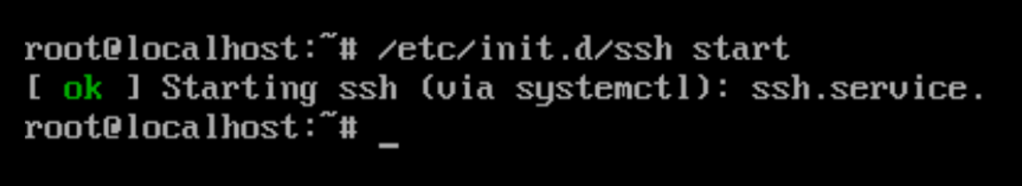
Today, NSX 4.1.0 provides some out-of-the-box Network Monitoring tools
IPFix Export
Port Mirror
TraceFlow
SNMP
Network Latency Statistics
Live Traffic Analysis
I am going to focus on NSX Live Traffic Analysis (LTA) and try and provide some insight too how one goes about using NSX LTA for Network Monitoring, Troubleshooting.
“Live Traffic Analysis (LTA) provides helpful insight about tracing live traffic and bi-directional packet tracing. Traffic analysis monitors live traffic at a source or between source and destination along with the packet capture. You can identify bad flows between the source and the destination. If the packet counter of the certain flow at the source endpoint is much higher than the packet counter of the certain flow at the destination endpoint, packet drop may occur between two endpoints. Hence the flow is probably a bad flow which you can trace for further analysis. Thus traffic analysis is helpful in troubleshooting virtual network issues. You can find the number of packet enter or leave a port, and the unexpected packet drop.”
Let’s start with what you need to know upfront before diving into using LTA.
Requirements
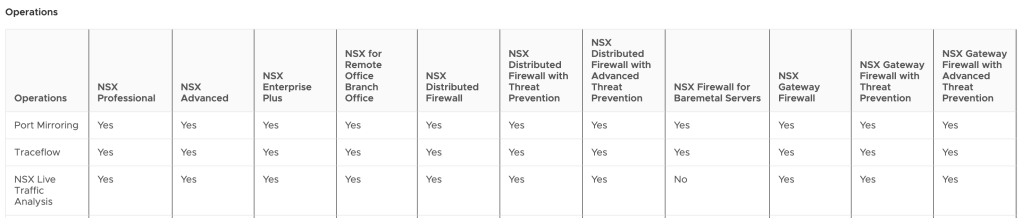
LTA was introduced in NSX 3.1.0 and the feature is available in all NSX licensing offers, with the exception of NSX Firewall for Baremetal Servers.
NSX Operation Features
For the full detailed list of NSX features to license mapping visit this link NSX Features. Be sure to focus on the correct NSX version which you have deployed.
There is no dedicated installation process required for LTA, once you have the NSX Manager deployed, you have LTA available. But do take note of the limitations below.
Limitations
These are the current limitations as per NSX 4.1.0 documentation, these may change in future releases.
LTA supports only on the overlay-backed NSX environments.
LTA with packet capture is not supported on Edge interfaces.
LTA is not supported on T0 Active/Active setup.
LTA is not supported on Global Manager.
LTA cannot observe VMC components that do not belong to the NSX management domain, such as IGW.
Let’s get Started
NSX Traffic Analysis
Where do I find LTA in the NSX dashboard??
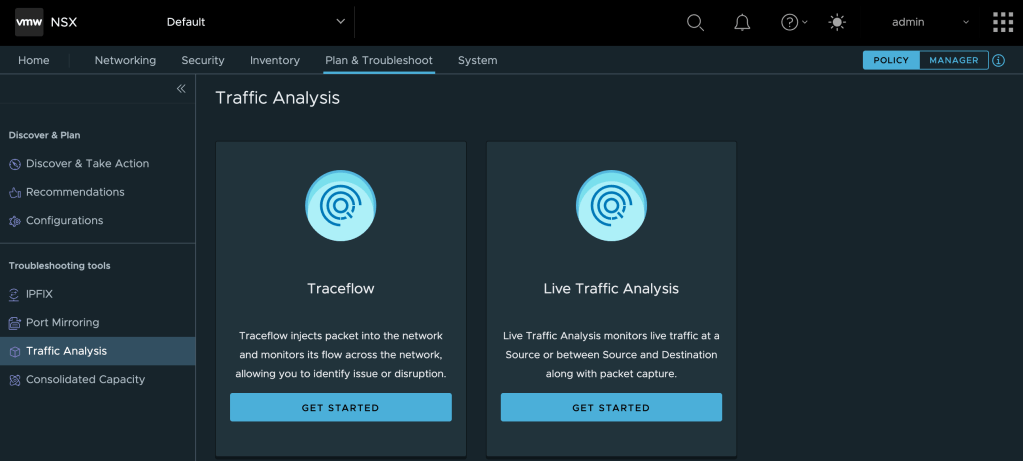
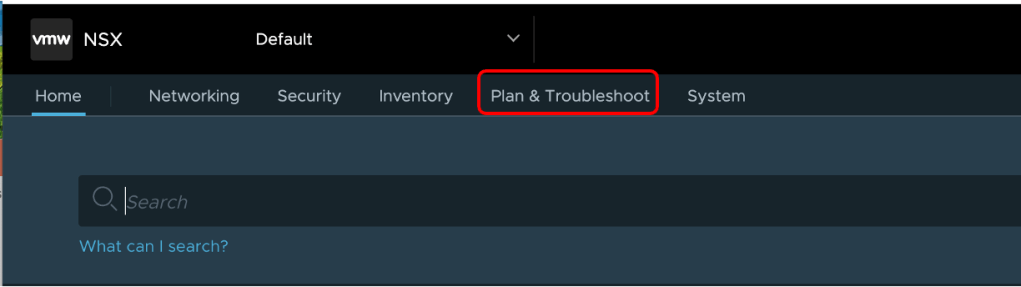
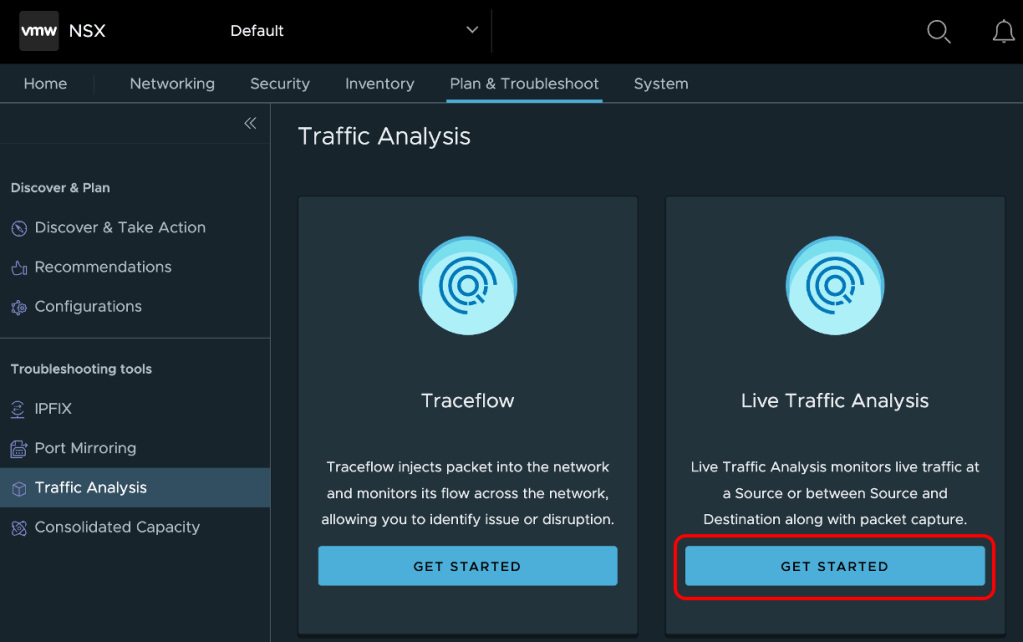
Step 1 – At the top of the NSX Dashboard select Plan & Troubleshoot
Step 2 – Select Traffic Analysis from the lefthand column.
Your view might differ from mine as I have NSX Intelligence installed in this environment but you will still see the Traffic Analysis in the menu.
Step 3 – Select Get Started on the right under Live Traffic Analysis
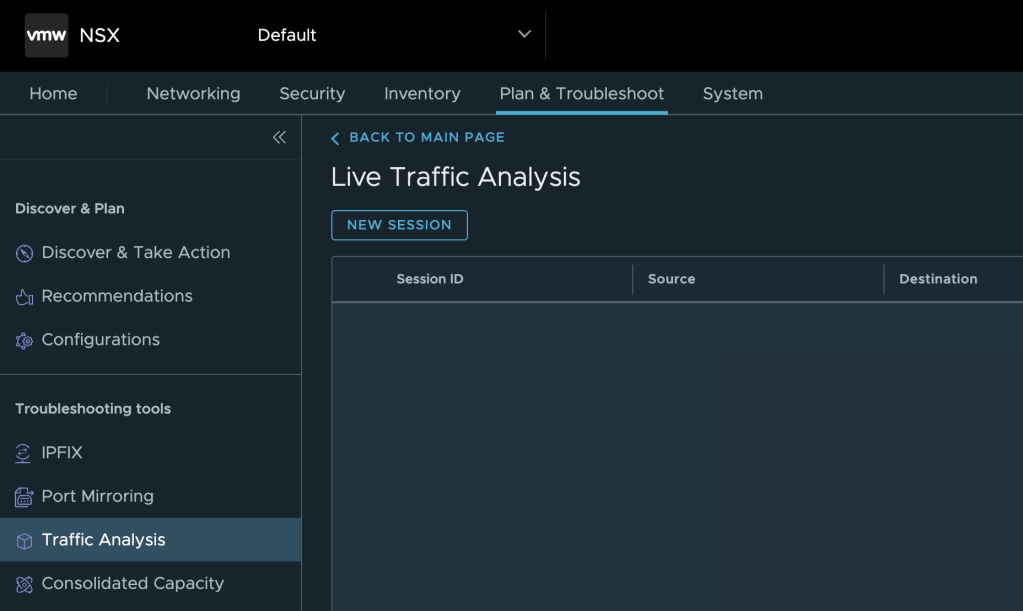
You should see the Live Traffic Analysis page as shown below.
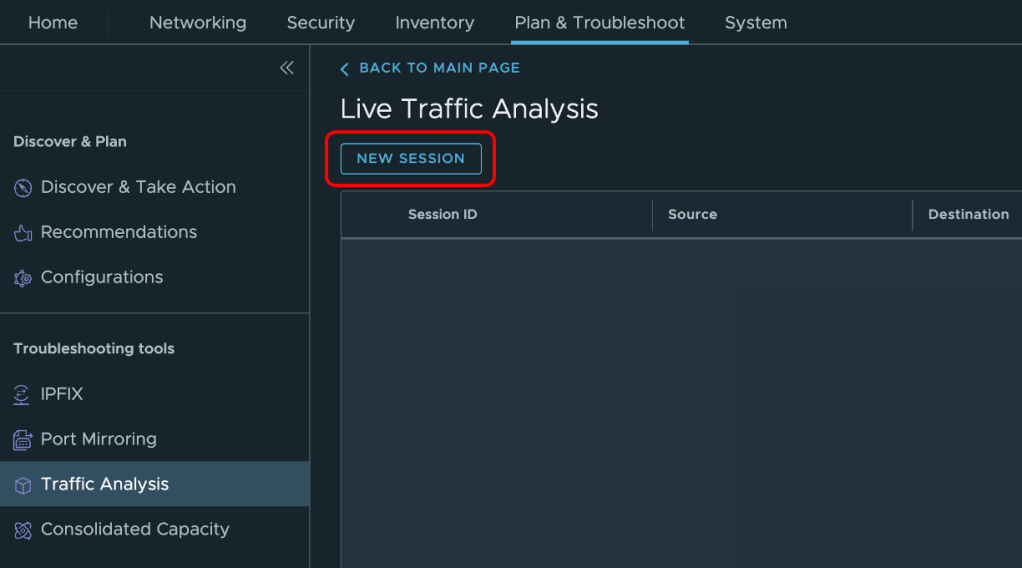
Let’s create our first Session
NSX LTA allows you to create a session to monitor the Live Traffic for one or two VM’s. So you can create a session that only has one workload which you want to monitor or you can select two workloads and monitor the traffic between these two workloads.
We will start with monitoring traffic on a single VM.
Step 1 – Select New Session under Live Traffic Analysis
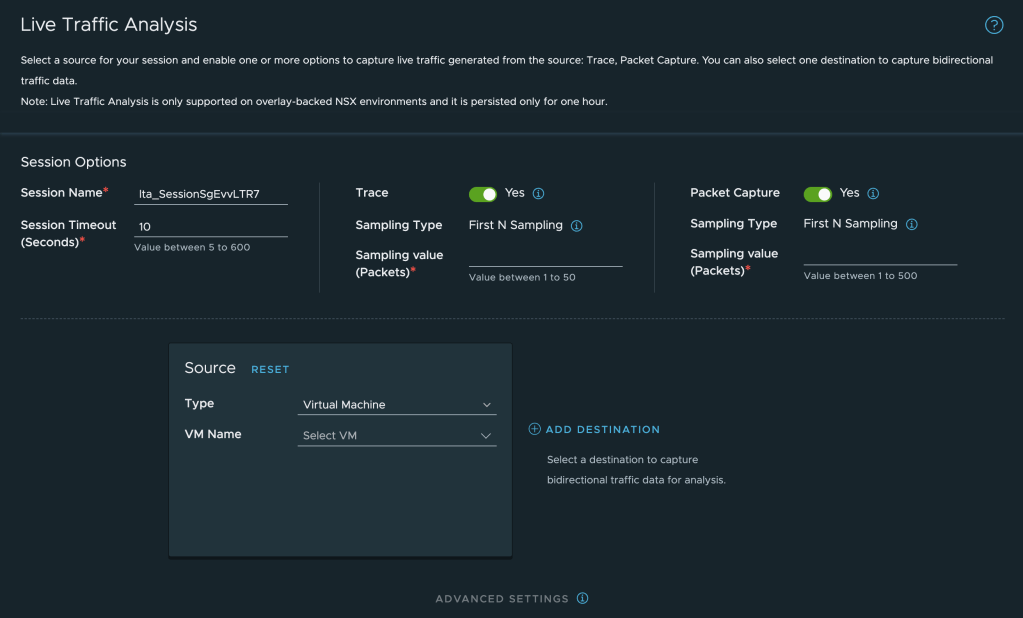
LTA provides a number of options and you will quickly see this once you have opened the UI to create your first session.
Step 2 – Select the options below under Live Traffic Analysis
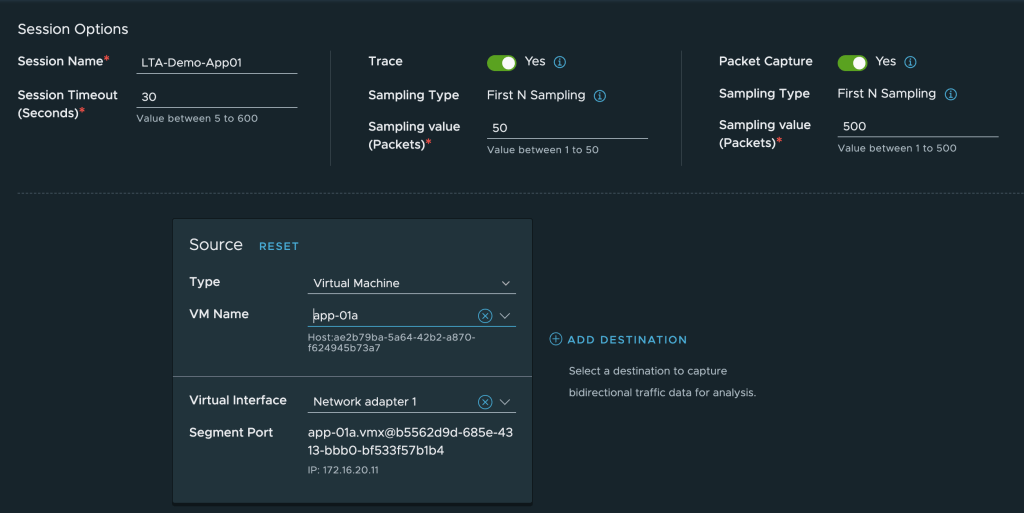
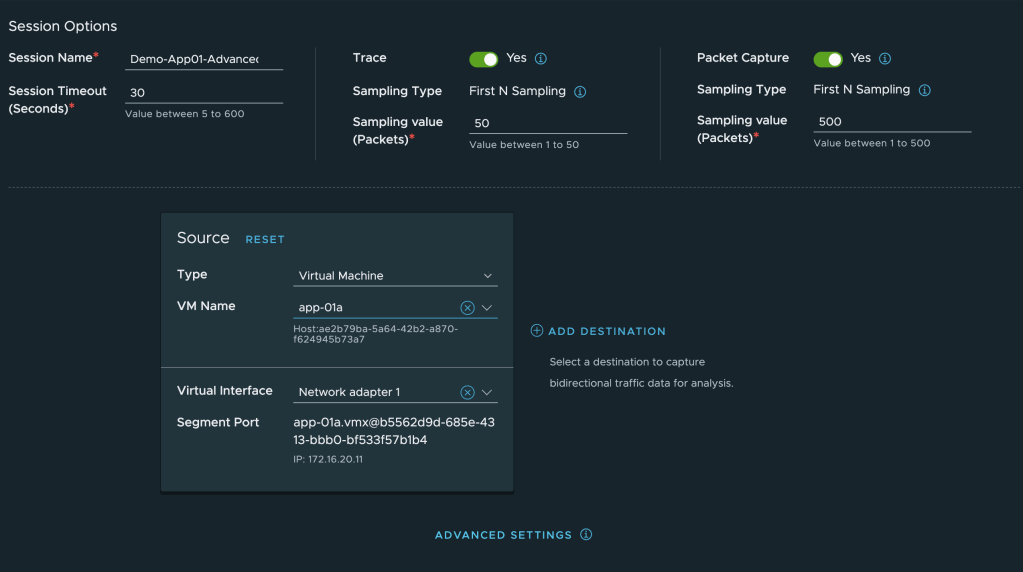
Session Options
Session Name = Enter a descriptive name here or the system will create a random name for you.
Session Timeout (Seconds) = Default timeout value is 10 seconds. You can add value between 5 to 300 seconds. This determines how long this session will capture traffic. If you leave it to the default setting, it will capture 10 seconds worth of traffic or you can configure it to run the capture for a maximum of 300 seconds or 5 minutes.
Trace (Yes) = By default, the toggle is active. Trace generates the packet traceflow. If you select only the source, system generates the traceflow for the packets ingressed from the source (matching the forward filter, if any). If you also select the destination, in addition system generates the traceflow for the packets ingressed from the destination (matching the reverse filter, if any).
Sampling Values (Packets) = First N number of packets that match the packet filter under the Advanced Settings tab are sampled for analysis. The default filter under the advanced settings matches all traffic. If you only select 1 one here, only the first packet is sampled/captured, so I am going to set this to the maximum configurable value – 50.
Packet Capture (Yes) = Generates the PCAP files with live trace telemetry. By default, the toggle is active. If you want to have the option to download a PCAP file to be used for further analysis using a tool like Wireshark, then leave this option default to Active.
Sampling Value (Packets) = Enter the value from 1 through 500. Again, if you set this to one, you will only see the first packet that matches the filter – the default filter matches all IPv4 traffic. So if you have not defined an advanced filter, then set this to the maximum value of 500 if you intended to see more than one packet 🙂
Source = Here we need to select the source which we intend to monitor – since we are only going to monitor a single VM initially only select one VM under source.
Type = You can select a VM here or a port/interface
Virtual Machine, select the VM in the drop menu
If the VM has multiple vNICs, select the correct vNIC else you can leave it to the default selected vNIC
Port/Interface (If you wanted to monitor a Port/Interface instead of a VM) You have the following options
Select an attachment type – Virtual Interface, Edge Uplink, or Edge Centralized Service.
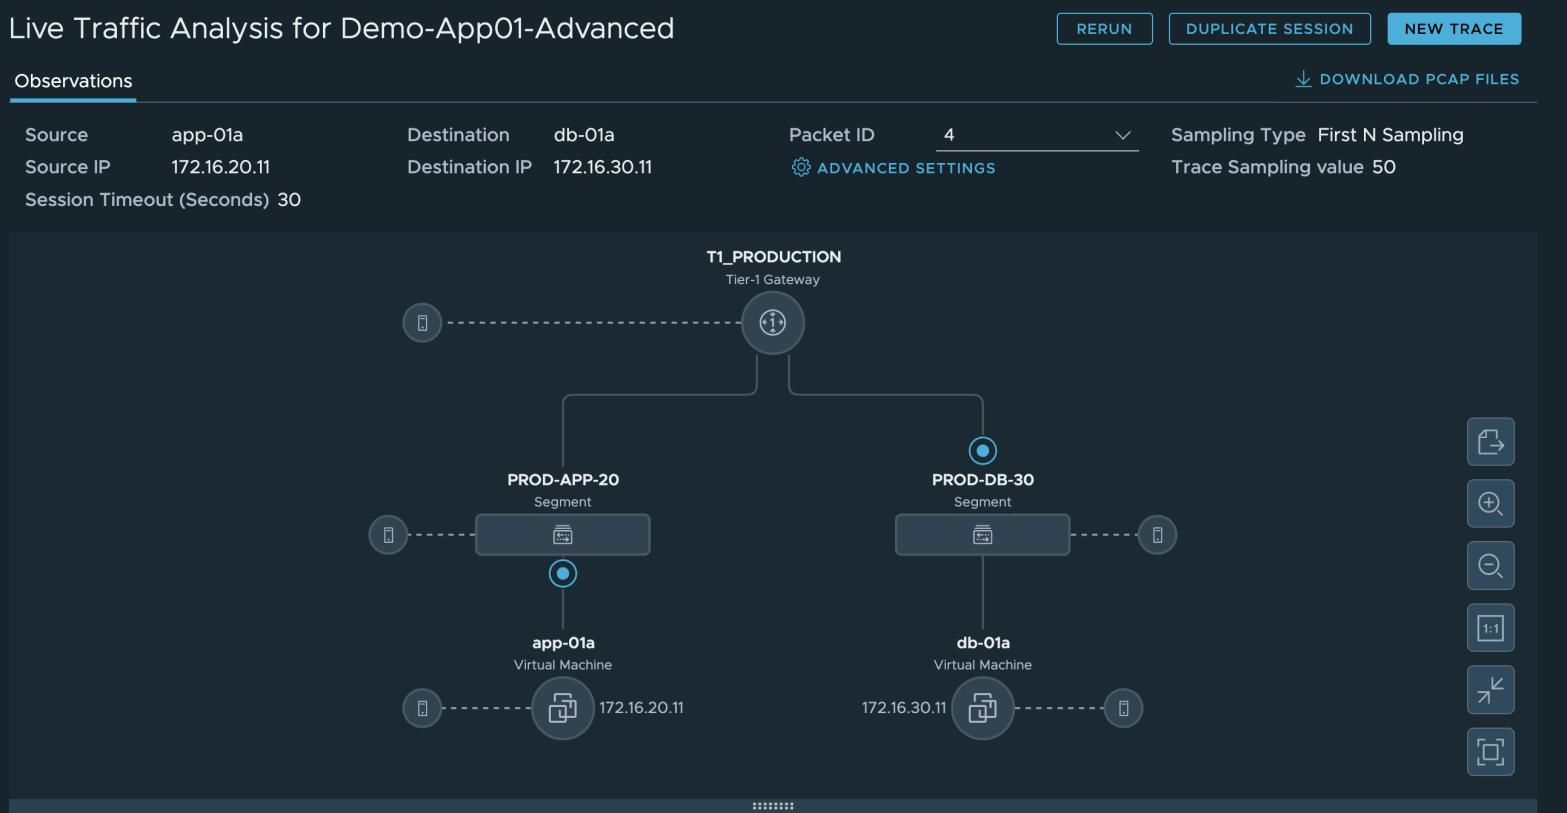
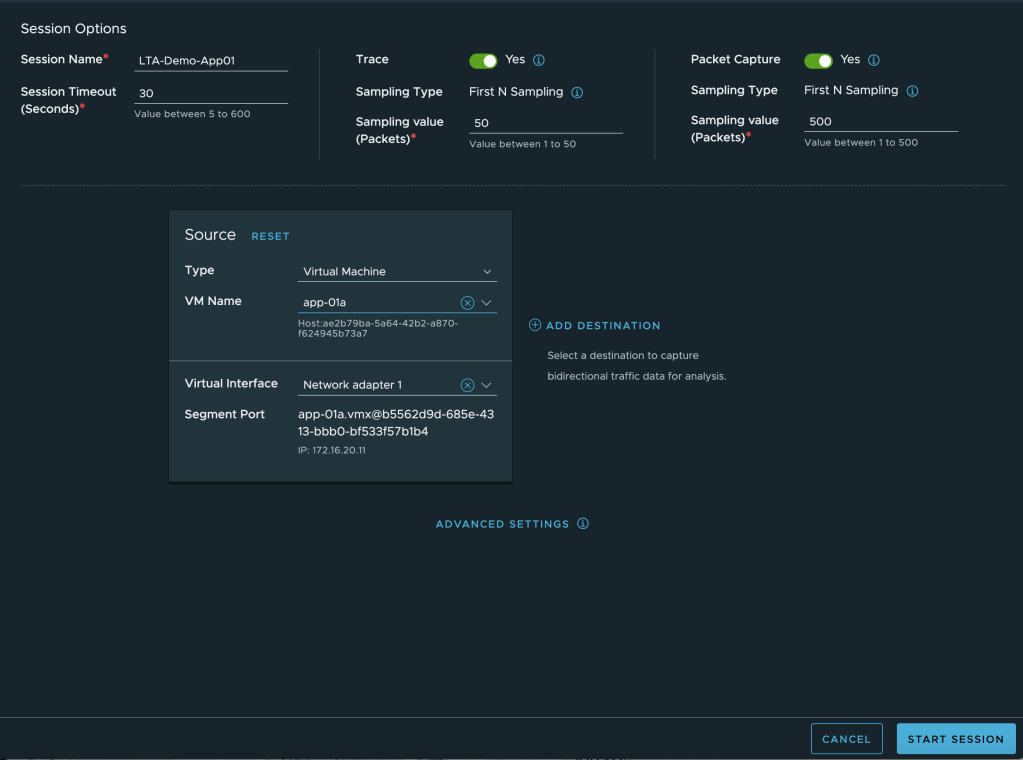
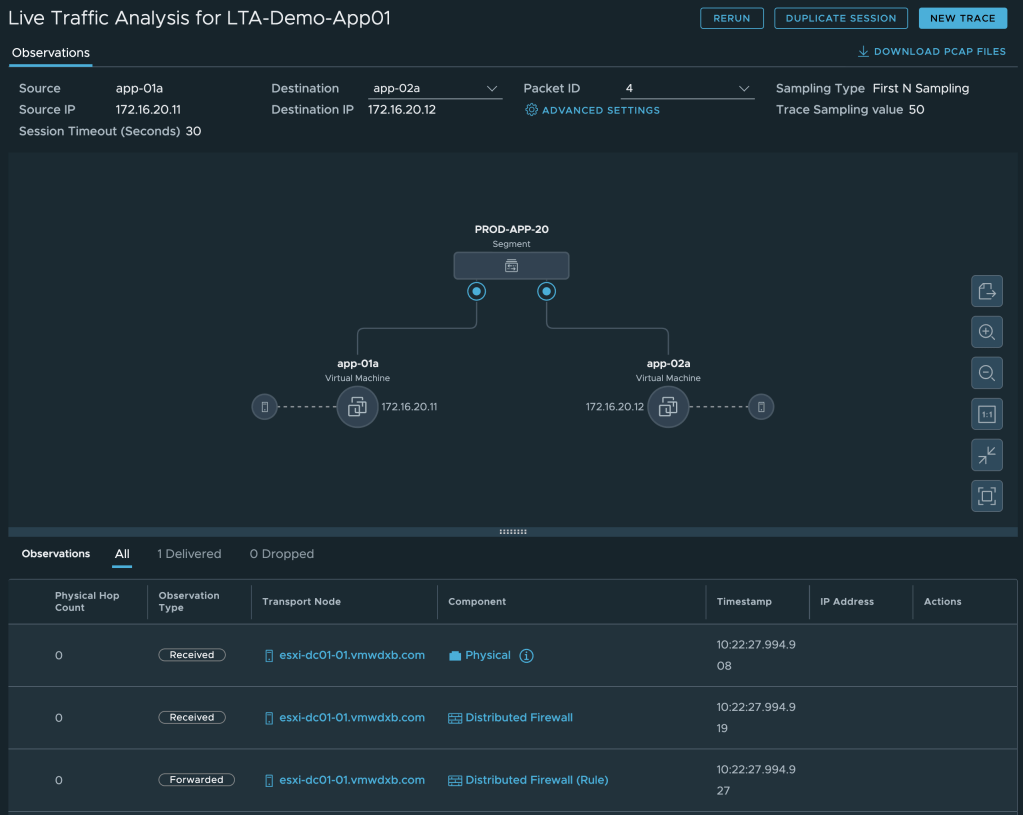
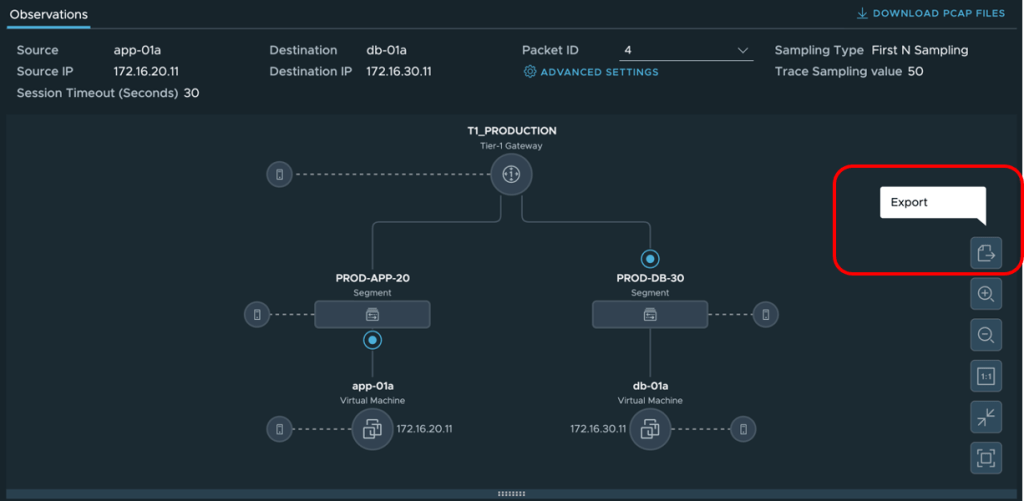
My First LTA Monitor Session
My First LTA Session settings are shown above.
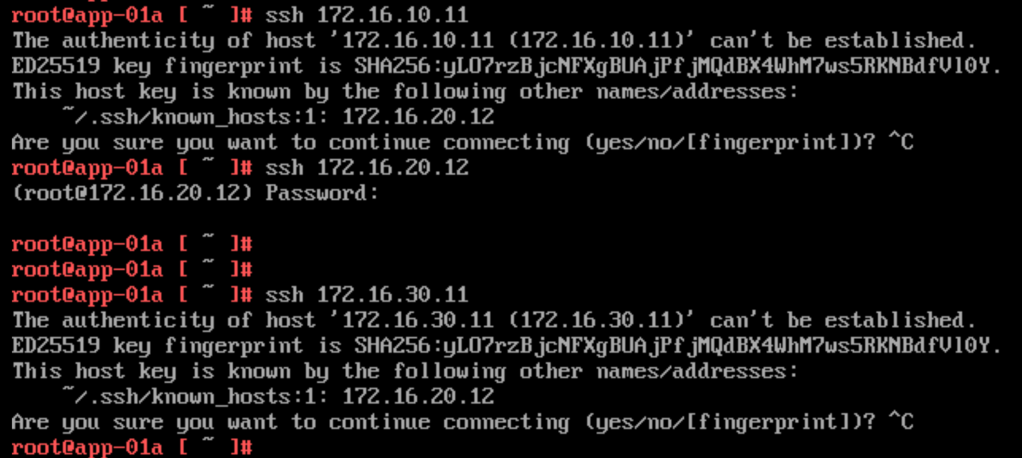
I am planning to run the monitor session for 30 seconds. I am going to monitor the traffic sourced from my App01 (172.16.20.11) to some other VM’s in my environment. I will do an ssh connection from App01 to App02 (172.16.20.12), DB01 (172.16.30.11) and Web01 (172.16.10.11). ***Take Note, my distribute Firewall is currently allowing all communication between these VMs.
Now to kickstart the session capture, click Start Session at the bottom right.
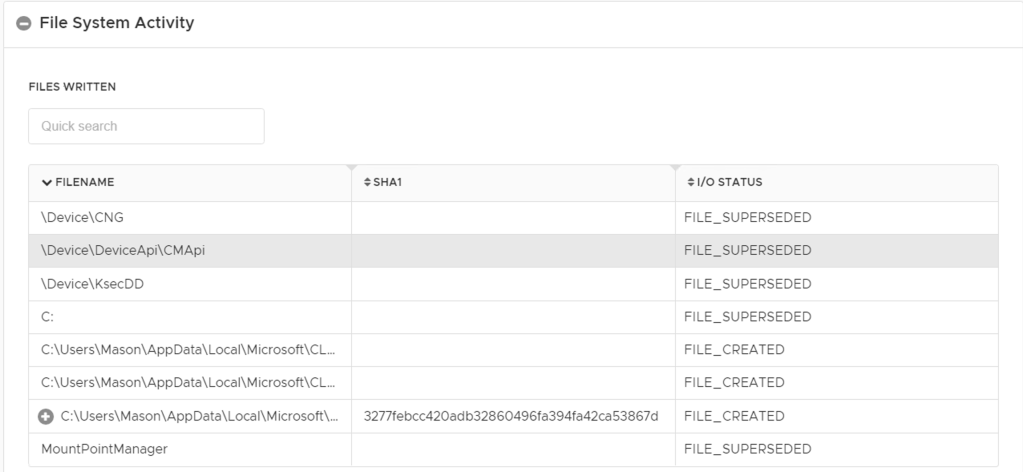
This is the traffic generated from App01
SSH from App01 to my earlier mentioned workloads
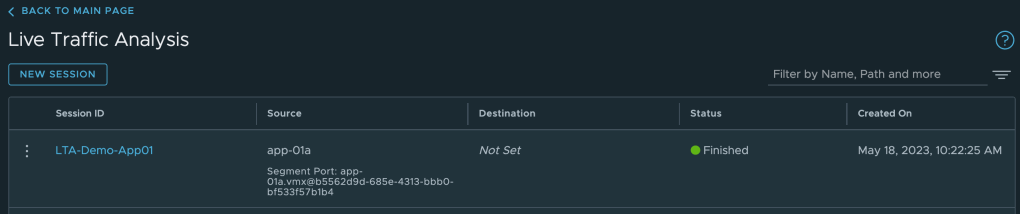
Let’s see the output of our first session
You should see your session status = Finished as shown below.
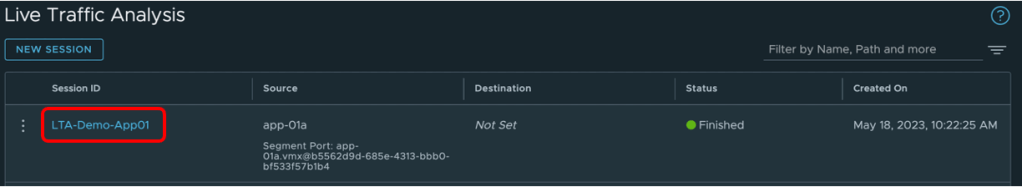
Click on your Session ID to open the results
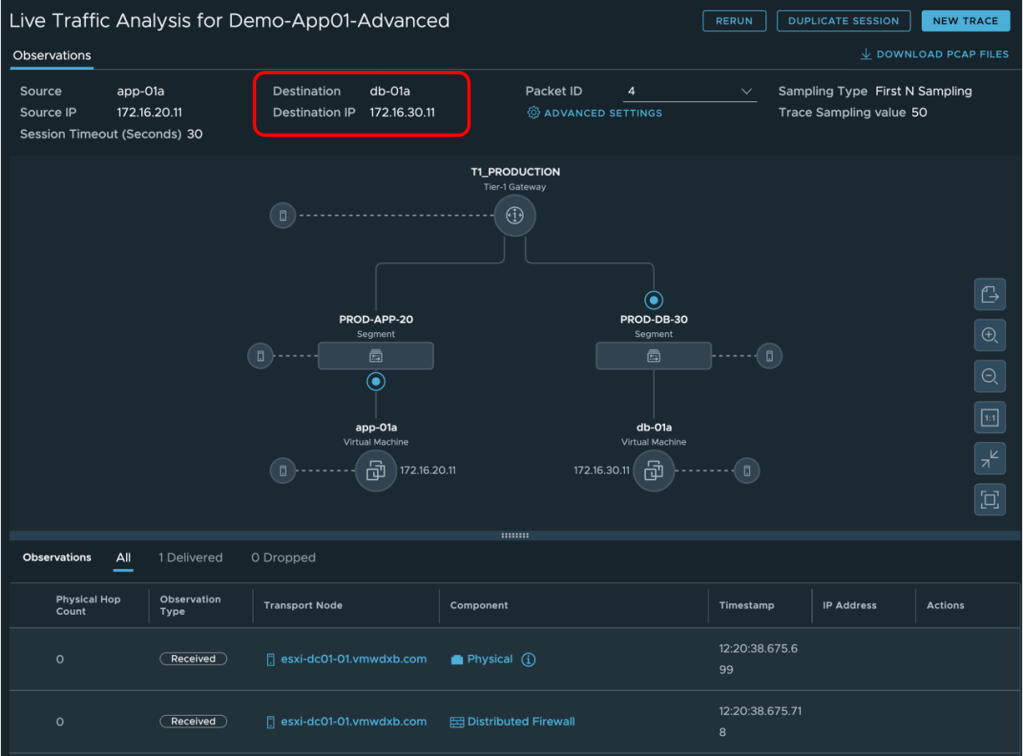
You should see the traffic which was generated while running the LTA session, in my case I do see the connection from App01 to App02 which was my first SSH session. You see the Traceflow topology generated and traffic observed hop by hop in your environment.
Click around on the observations and click on the components and view the various outputs.
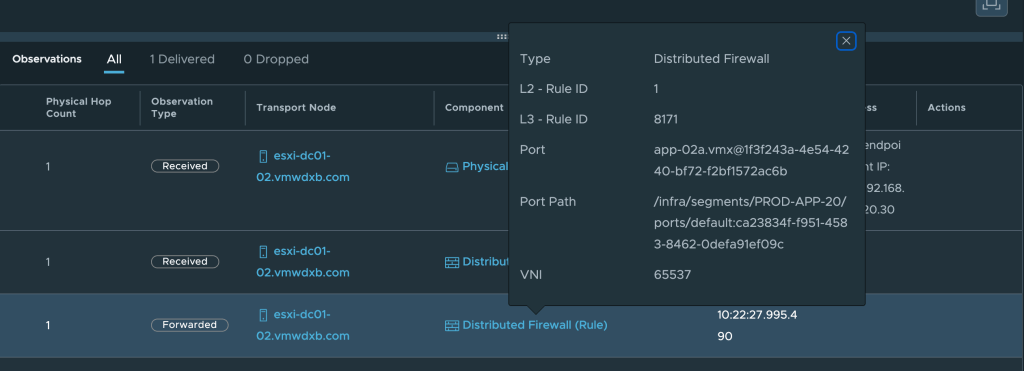
Output for traffic from App01 to App02Details when clicking on Distributed Firewall Rule
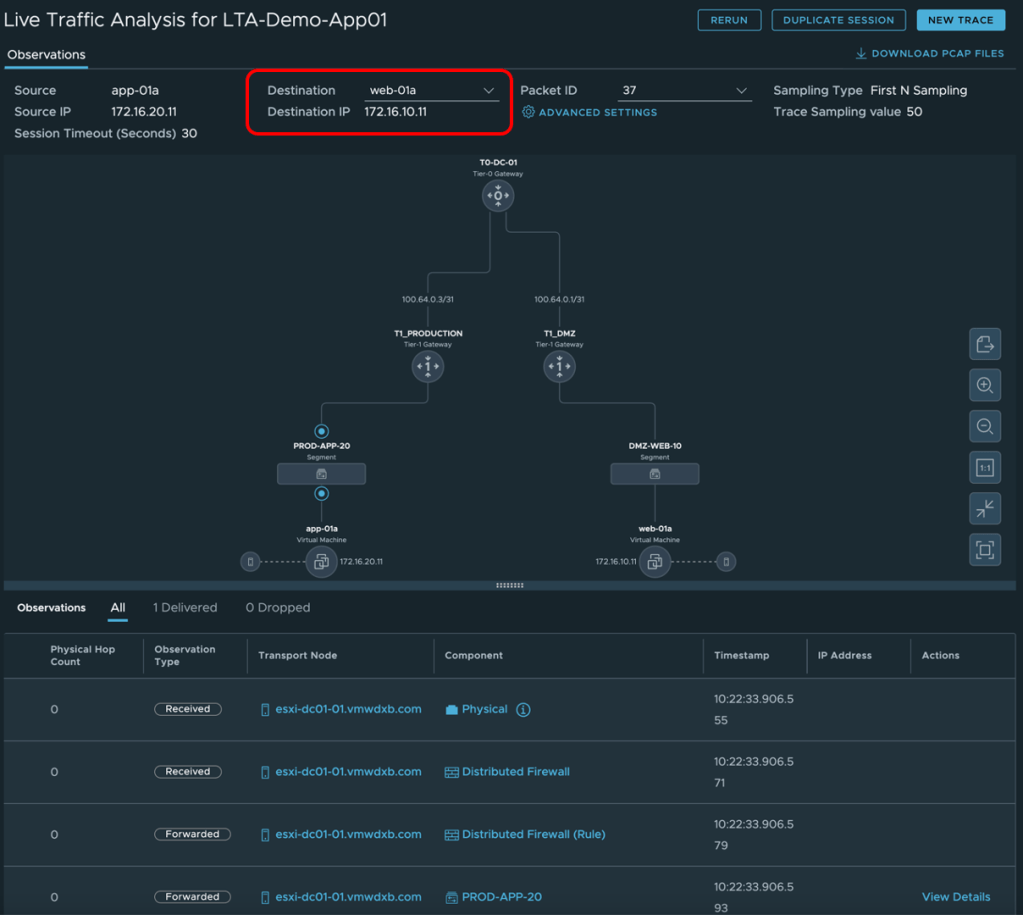
If you have generated traffic to more than one destination, you will see an option in the destination drop menu to select these. Below I have selected my Web-01a VM and you can see that the Traceflow topology is updated too – These two VMs are connected to different T1’s as seen below.
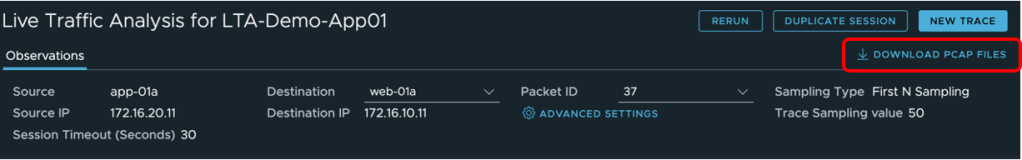
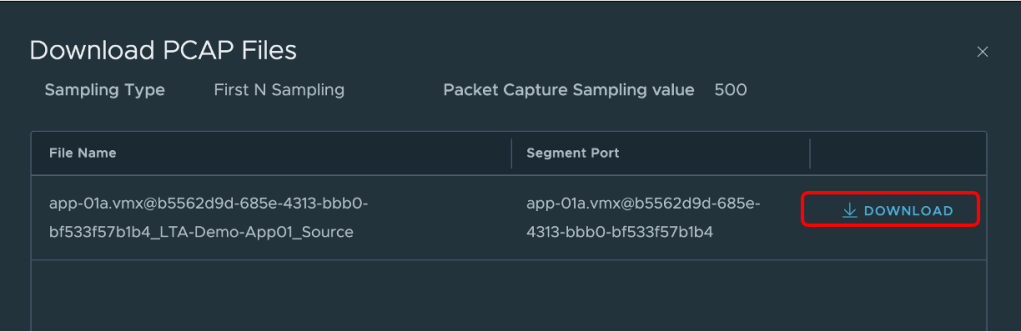
Download the Packet Capture
You also have the option to download a PCAP file of the packets captured in this session.
While keeping the session open, you see on the right-hand side “DOWNLOAD PCAP FILES” click this
Now on the window that opens select Download – select the destination on your local machine where to download and save the PCAP file too.
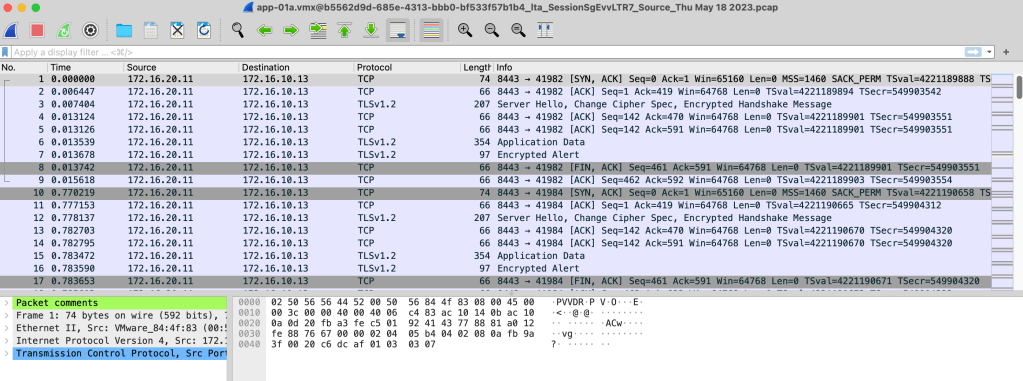
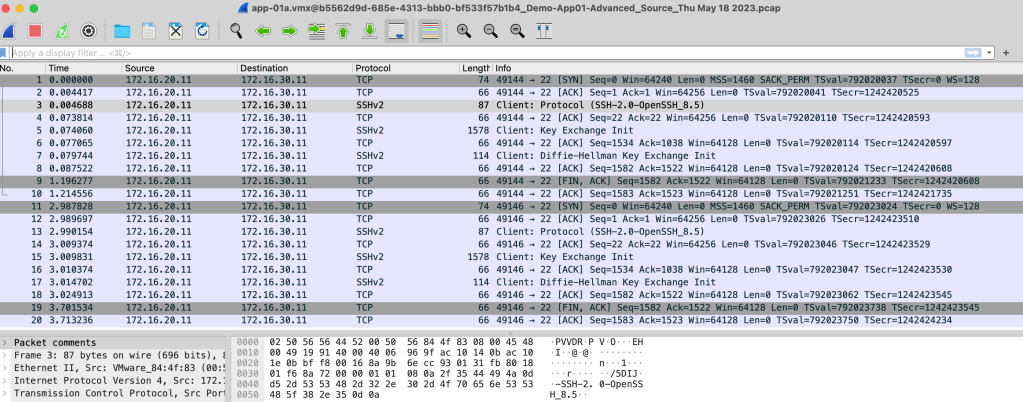
Once you have the file download to your local desktop or machine where you have Wireshark running, you can now open the file for detailed analysis.
PCAP File opened Wireshark
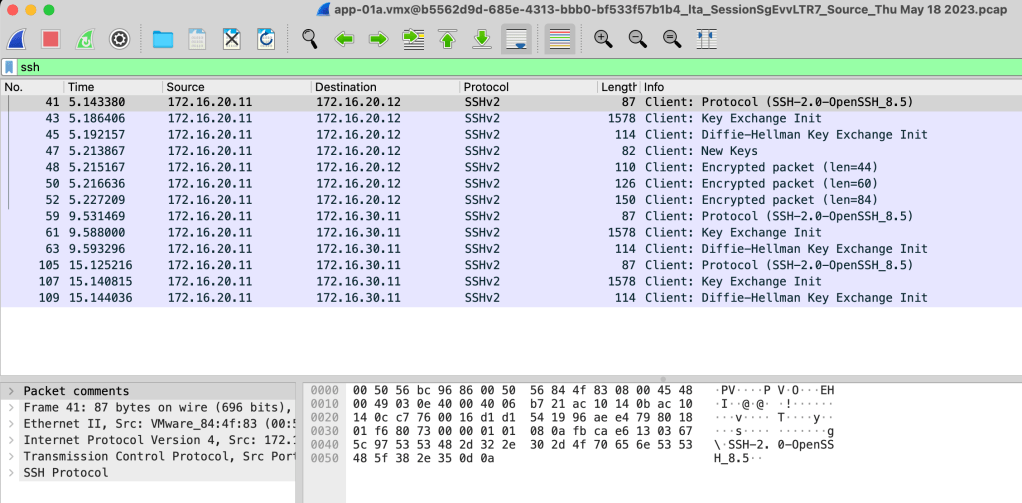
Let me set a filter on the traffic in Wireshark so that I only see SSH traffic
Here we can see the SSH connection from 172.16.20.11 to 172.16.20.12 and 172.16.30.11
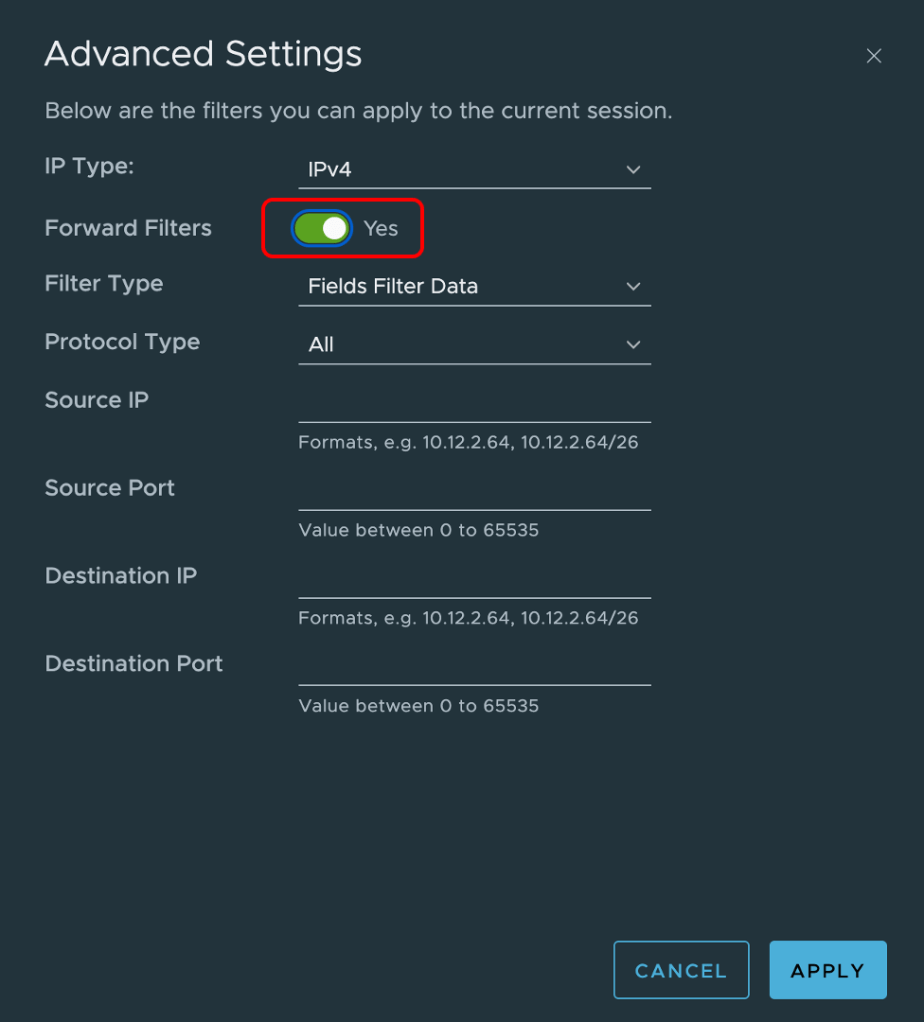
Advanced Settings
Now let’s see what we can do using the advanced settings when creating the session.
I am going to create a new session with the same parameters as our previous example – just changing the name – and I will open the advanced settings tab at the bottom.
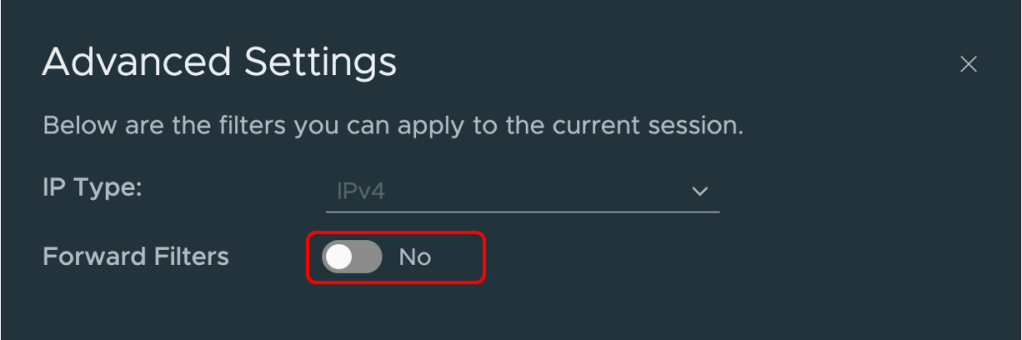
The default filter is set for all IPv4 forwarded traffic.
Click on the sliding option Forward Filters and you are presented with a list of options to create a custom filter on the captured traffic so that you could potentially focus on specific traffic or connections.
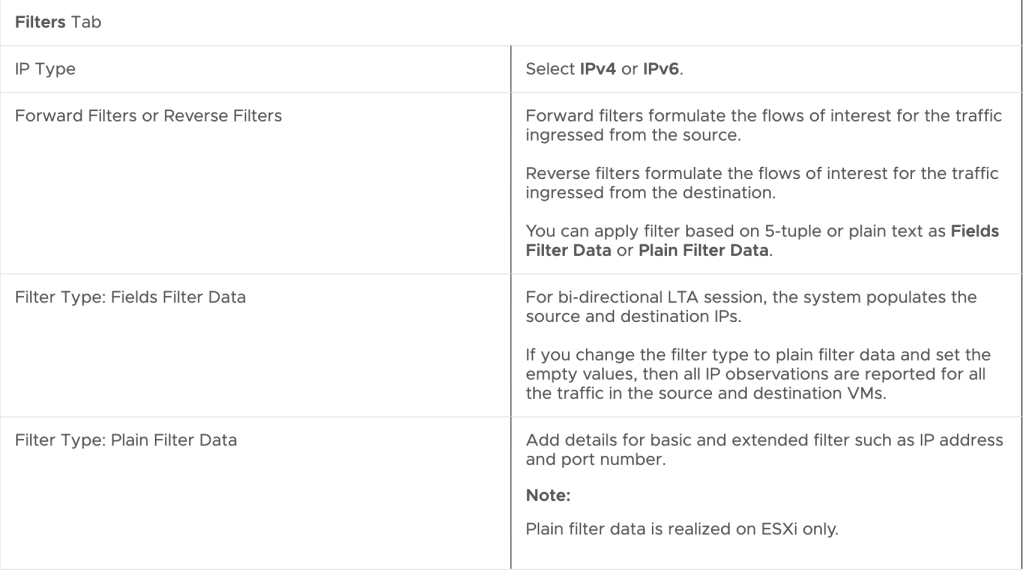
The filter values and options and summarized here:
Advanced Filter Settings
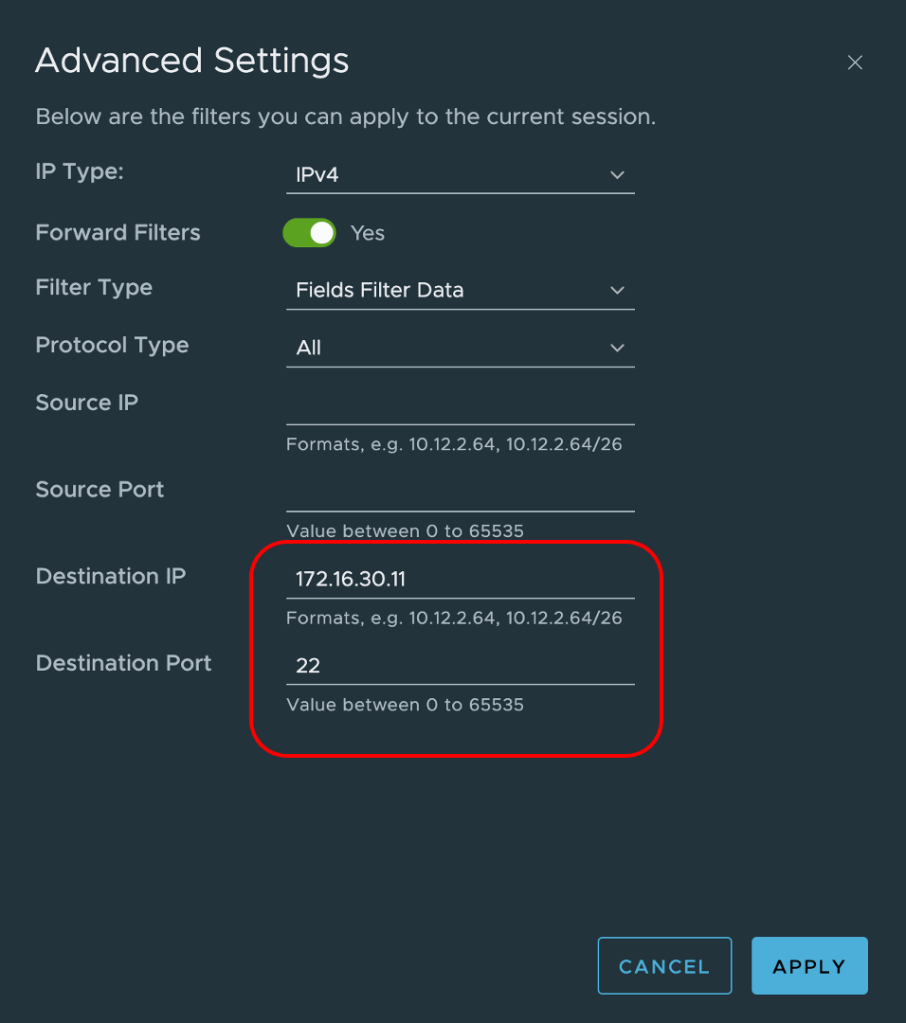
As an example, I will create a Filter matching the destination IP 172.16.30.11 and port 22 and click Apply
Custom Filter for DB01
I have generated some traffic from App01 to Web01, App02 and DB01 as shown below
Once the Advanced LTA session completes, I opened the session as before by clicking on the session name. The output is now filtered to only show my traffic matching my filter. There is no drop menu in the destination matching Web01 or App02.
Now I downloaded the PCAP file created for this session and opened this in Wireshark. You see from the output below without any filter set, we only see traffic with a destination matching the filter set (172.16.30.11 and port 22)
Some other options
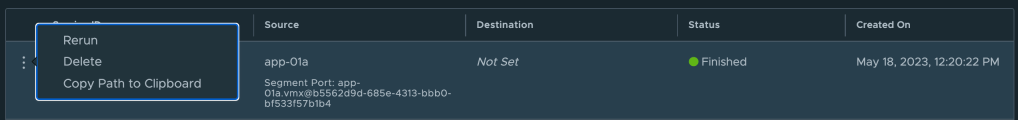
If you wish to rerun the capture without having to recreate all the settings, click on those 3 dots next to the session name and just click Rerun
If you want to export the topology shown in the capture session – click the Export option on the right-hand side.
Summary
The intention of doing this blog was to provide some visibility of one of the monitoring tools which is natively available in NSX and mostly overlooked.
It definitely helped me to better understand the capabilities and how to use the tool effectively.
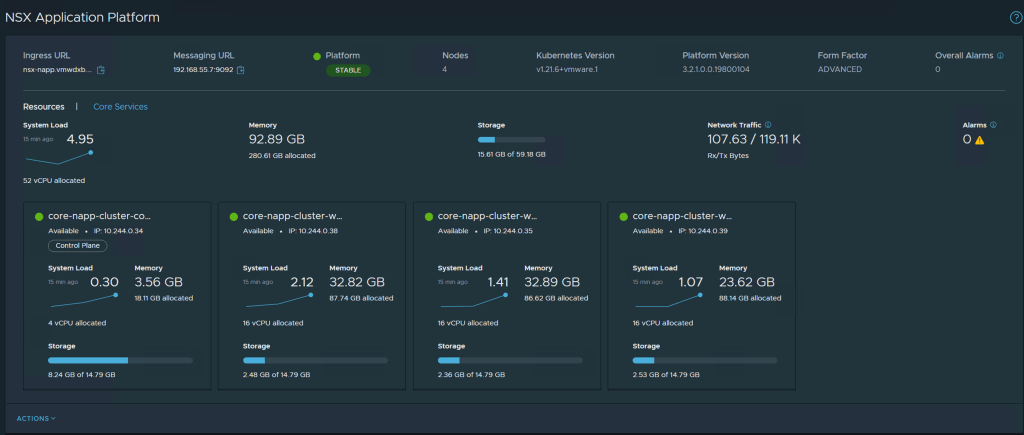
In this post I will address the upgrade process for the NSX Application Platform (NAPP) and the NSX Features running on the NAPP platform namely NSX-T Intelligence from 3.2.0 to 3.2.1. VMware released the NSX-T Intelligence 3.2.1 update on 17th May 2022. NSX Intelligence 3.2.1 is a maintenance release that fixes some unwanted issues.
When I started out preparing for the upgrade and capturing the steps for this blog, I faced some issues with my setup. I could not see the NAPP 3.2.1 upgrade option in the upgrade co-ordinator. I asked around and tried finding some reference point but I eventually put it aside until this morning when reviewing someone else’s deployment with one of the NAPP specialists in VMware. He raised some points on vCenter versions and Tanzu Supervisor cluster versions so it prompted me to go back to my setup and make sure I had all the components running the latest versions. I noticed that I too was using an older release on my Tanzu cluster and proceeded to upgrade the Supervisor and the guest clusters.
Post upgrade, I went back to the NSX-T UI and the 3.2.1 NAPP upgrade option was visible to me – now I don’t know if there was something else not working on the public Helm Repository/Docker Registry. So I have captured the exact versions of all my components for reference:
NAPP Platform Source version will be 3.2.0.0.0.19067744 and Target 3.2.1-0.0-19800104
Lets Get Started
Take note, my NSX-T Manager has been upgraded 3.2.1
The cool part about this upgrade is that I did not need to download any upgrade packages, the NSX-T Manager uses the the VMware hosted Helm and Docker registry to download the packages.
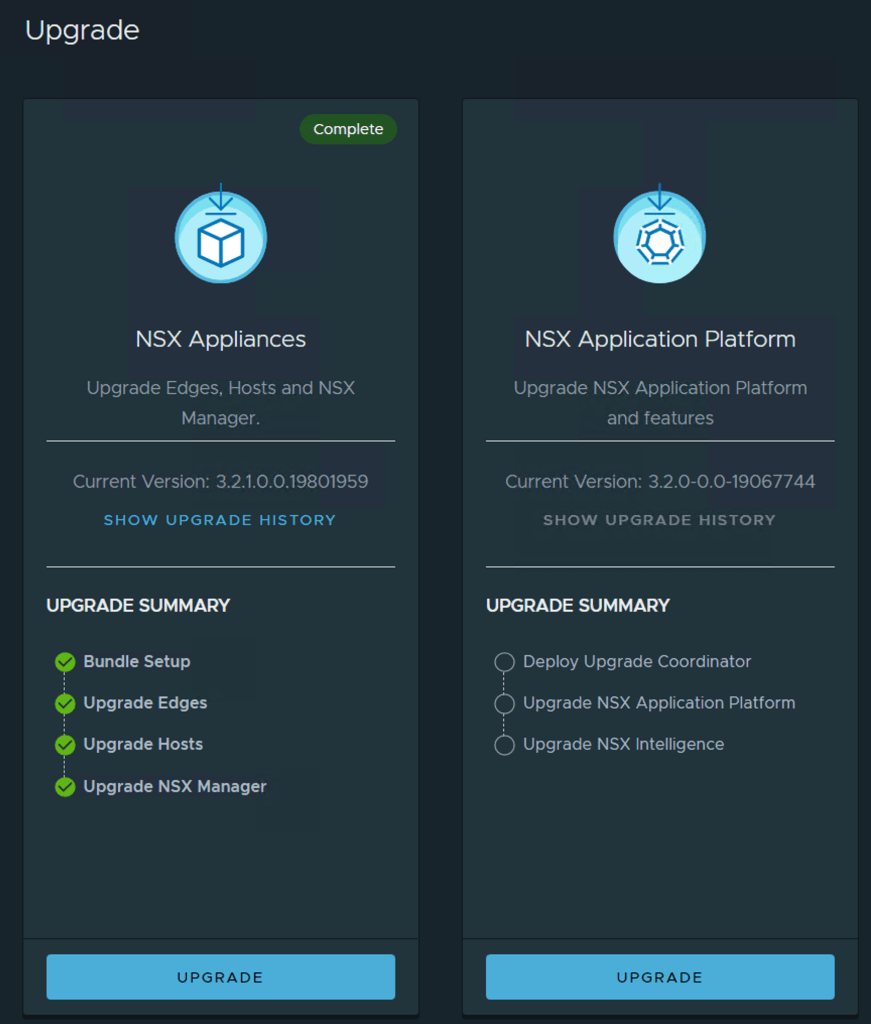
Step 1 – From the NSX-T Manager browse to -> System -> Upgrade and click Upgrade under NSX Application Platform
If you do not see the correct target Platform version at this point, I suggest going back to your Tanzu setup and make sure it has been upgraded to the latest release – assuming that you are using Tanzu.
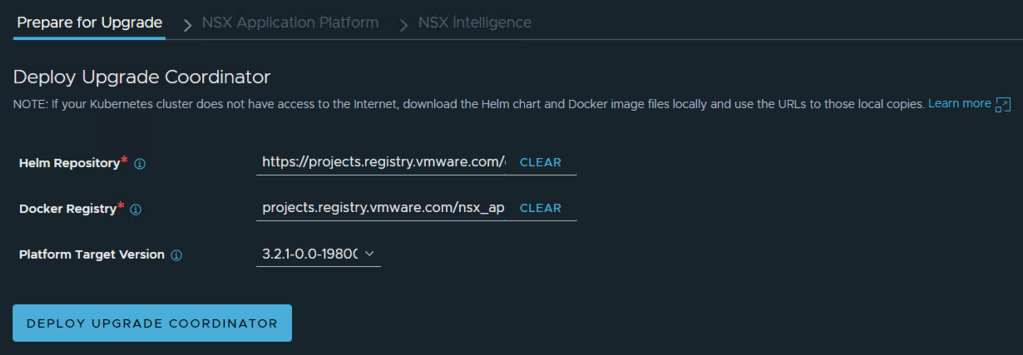
NOTE: If your Kubernetes cluster does not have access to the Internet, download the Helm chart and Docker image files locally and use the URLs to those local copies.
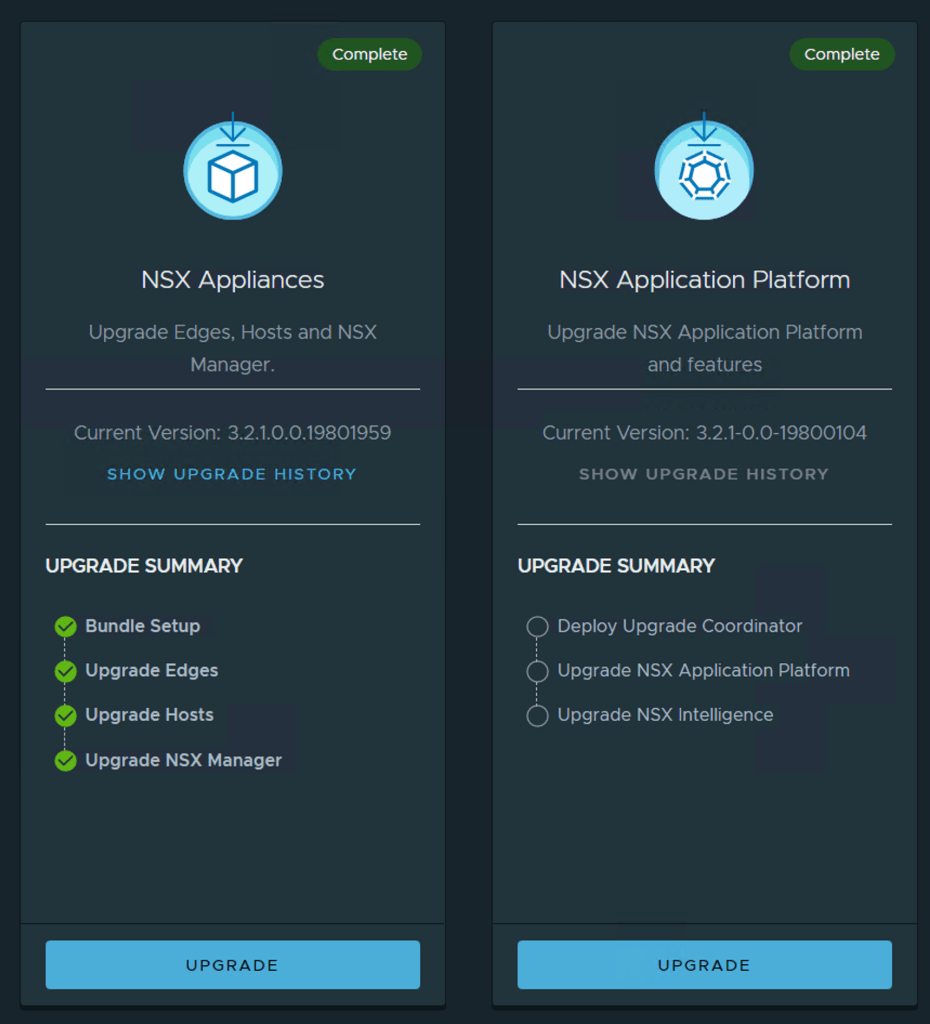
Deploying Upgrade CoOrdinator
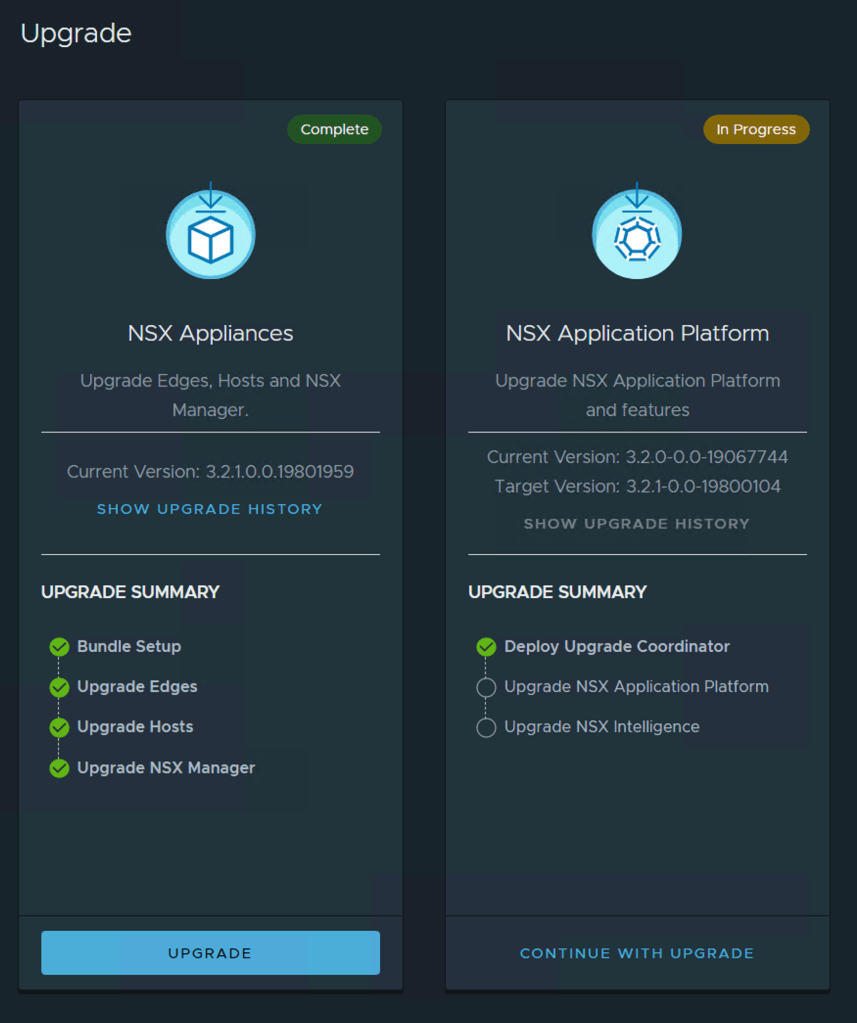
This will take a little time and will depend on your environment. Once the deployment of the upgrade coordinator completes I can see the current version and the target version. Click -> Continue with Upgrade
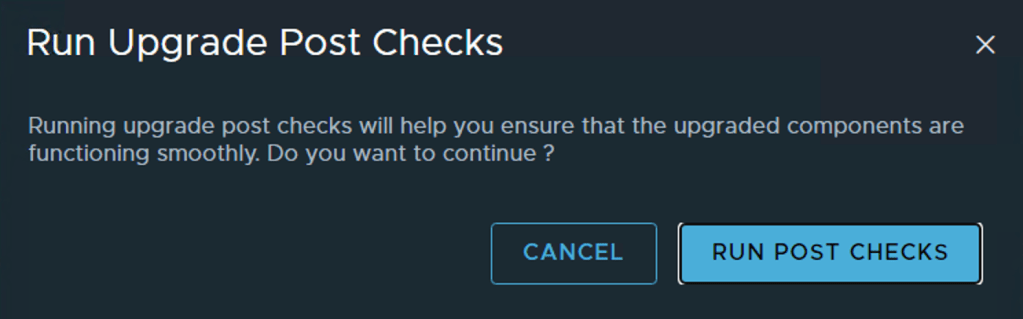
Step 3. Perform the Pre-Checks -> Click RUN PRE-CHECKS, ALL PRE CHECKS
This performs the pre-checks on the NAPP Platform and the services running on top of NAPP.
RUN PRE-CHECKSPRE-CHECKS Successful
If your system returns any errors, do not proceed with the upgrade and attend to those first.
Step 4. Proceed to the upgrading NAPP window -> Click Next, at the bottom right
NAPP Platform upgrade
Step 5. Now -> Click Upgrade, this will upgrade the NAPP platform first.
***Do not power-off or reboot the nodes when upgrade is in process. They may be rebooted automatically as part of the upgrade process.***
You can monitor the upgrade process by expanding the arrow next to Cert-Manager
Cert-Manager Upgrade
Post upgrade of the Cert-manager
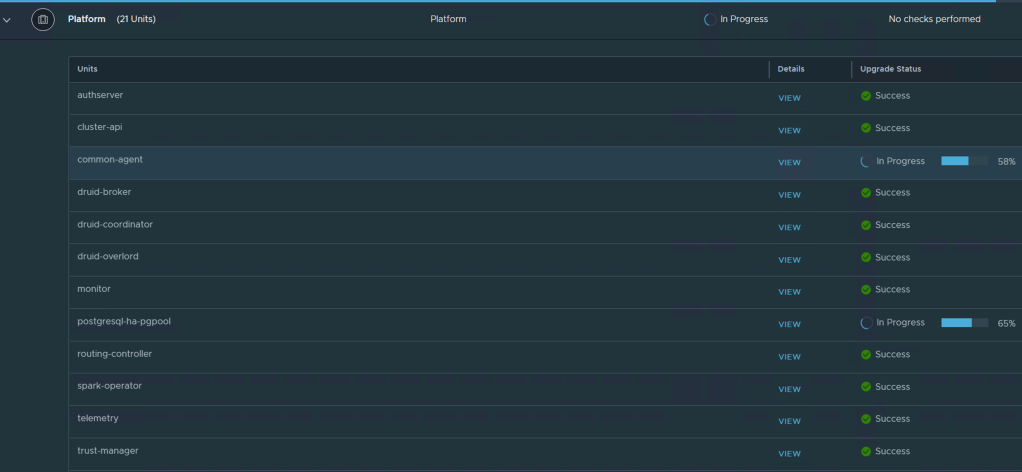
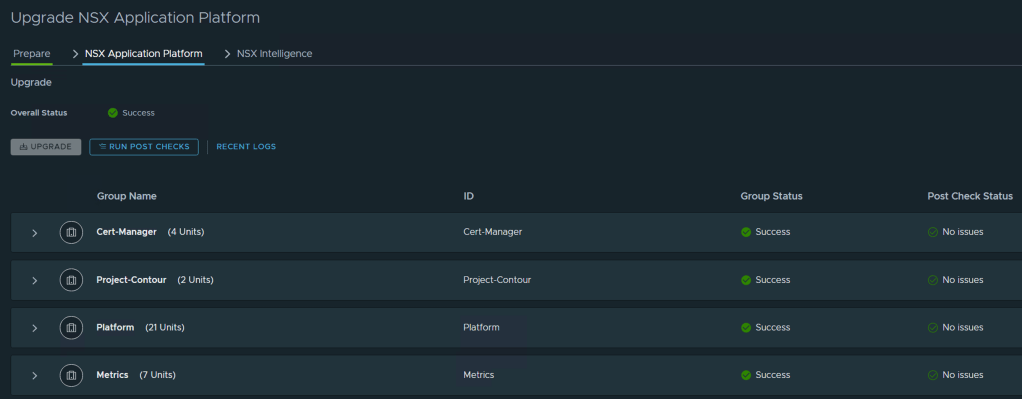
The same upgrade process can be monitored for Project-Contour, Platform and Metrics. These are upgraded in sequence. The Platform upgrade process took some time as it upgrades 21 different components
Platform Upgrade progressNSX Application Platform
Step 6. Once all the components have been upgraded and the overall status reaches Success, perform the POST Checks -> Click Run Post Checks
NAPP Post ChecksPost Checks Run
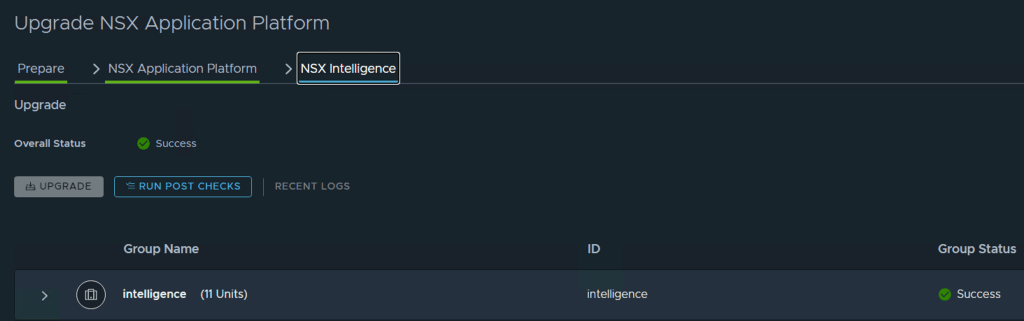
Step 7. After the post checks are clear, you can click -> Next on the bottom right and proceed to upgrading NSX Intelligence.
NSX Intelligence upgrade
Step 8. Click -> Upgrade to start upgrading NSX Intelligence
Upgrading NSX-T Intelligence
Step 9. Once completed the overall status shows success and you can run the post checks again.
Step 10. Once the post check are complete and clear, click -> Finish on the bottom right.
Now we have successfully upgraded our NAPP platform and the NSX Intelligence service to 3.2.1.
The same can be checked and validated under the NSX Application Platform tab.
NSX Application PlatformNSX Metrics and NSX Intelligence upgraded to 3.2.1
Just a quick check on the status of NSX Intelligence, I see active flows
Summary
Make sure you are running the latest versions of vCenter and Tanzu Supervisor Cluster software to avoid any strange behaviour 🙂
VMware NSX-T 3.2.1 went Generally Available on the 17th of May – Release Notes. This post will focus on upgrading my NSX-T 3.2.0 environment to NSX-T 3.2.1. This is not a major release so I am anticipating a fairly straightforward update.
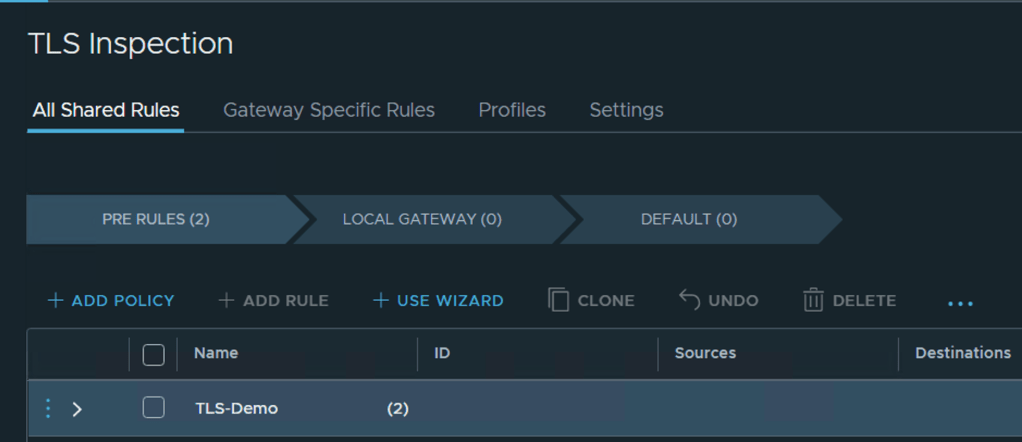
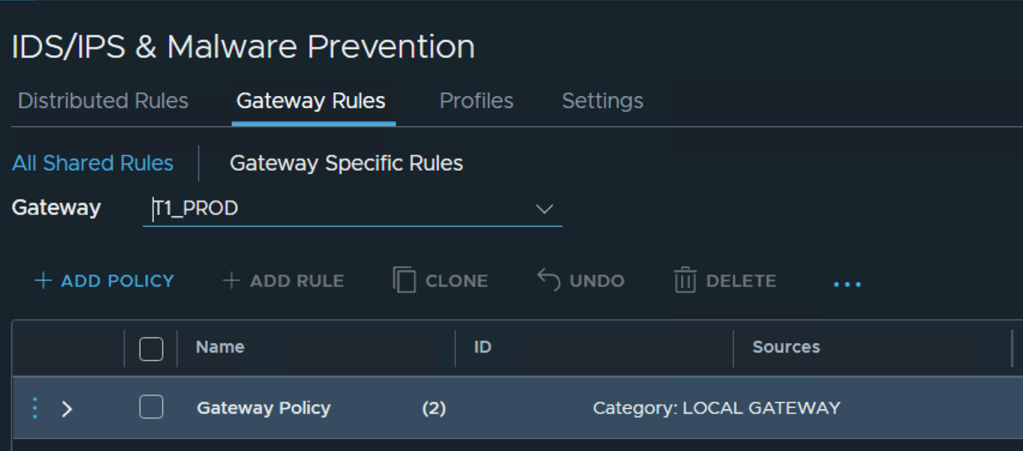
My main reason for upgrading would be the Security features introduced in 3.2.0 as Tech Preview and now generally available in 3.2.1. (Gateway TLS Inspection & Gateway IDPS)
Here are some highlights taken from the release notes:
Distributed Firewall
Distributed Firewall now supports Physical Server SLES 12 SP5.
Gateway Firewall
TLS 1.2 Inspection was on Tech Preview mode in NSX-T 3.2, and now it is available for production environments in NSX-T 3.2.1. With this feature, Gateway Firewall can decrypt and inspect the payload to prevent any advanced persistent threats.
IDPS (Intrusion Detection and Prevention System) is introduced in NSX-T 3.2.1. With this feature, Gateway Firewall IDPS detects any attempt to exploit system flaws or gain unauthorized access to systems.
Install and Upgrade
Rolling upgrade of NSX Management Cluster – When upgrading the NSX Management Cluster from NSX-T 3.2.1, you can now get near-zero downtime of the NSX Management Plane (MP) by using the Rolling Upgrade feature. With this feature, the maintenance window for MP upgrade gets shortened, and NSX MP API/UI access is up throughout the upgrade process while not impacting Data Plane workloads, as before.
Getting Started
VMware provides an extensive upgrade process here. My intention is to follow the upgrade process and capture the process here with screen shots at each step.
Before upgrading your environment you must review the base requirements, if you don’t meet all these requirements then get those sorted out before proceeding to upgrade:
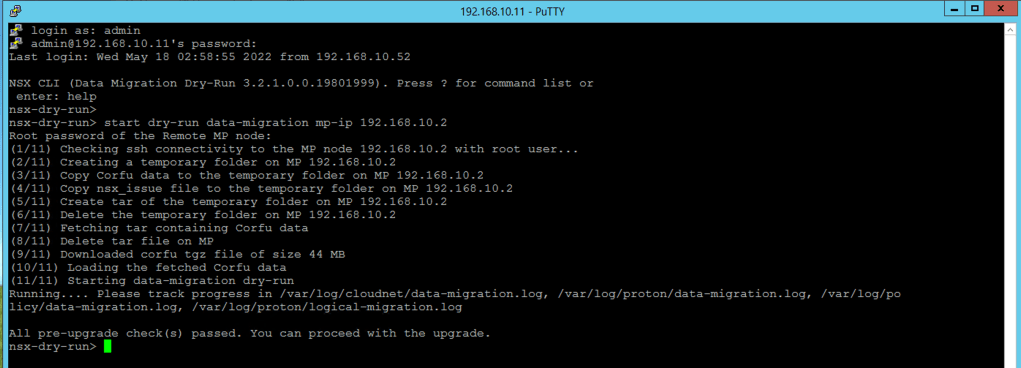
Just after the NSX-T 3.2.0 release, VMware released an NSX Upgrade Evaluation tool which was suggested to use for customers wanting to upgrade from earlier versions of NSX-T to 3.2.0.1 (3.2.0 was removed from the download portal). The tool can be downloaded from VMware’s download page and you can use it to verify you environment for 3.2.1 upgrades too. More details on the tool here.
Steps to run this tool:
1. Deploy the NSX Upgrade Evaluation Tool VM in your environment. 2. After deploying the VM, login to the CLI of the Upgrade Evaluation Tool VM as ‘admin’ user 3. Run the command: ‘start dry-run data-migration mp-ip <NSX Manager Node IP>’ a. Provide the IP of any one of the 3 NSX Manager nodes, and the root password
All pre-upgrade check(s) passed. You can proceed with the upgrade.
All pre-upgrade check(s) passed. You can proceed with the upgrade.
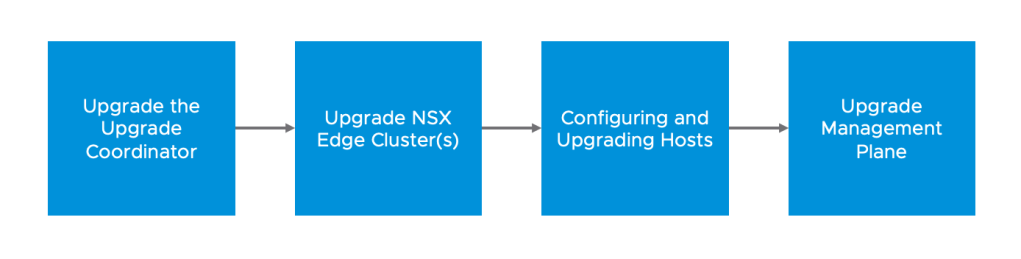
Now that we are comfortable that our environment has passed all the pre-upgrade checks, let’s move onto the upgrade process.
Upgrade Process
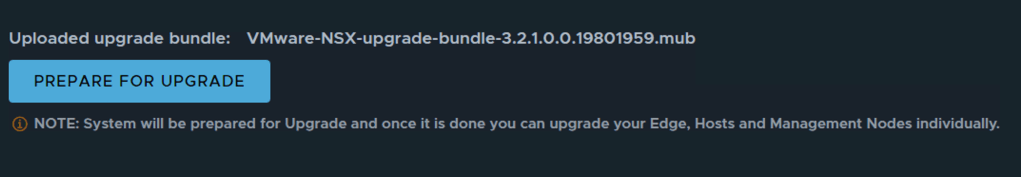
Make sure to download the Upgrade bundle from VMware’s website, it normally ends in mub
VMware-NSX-upgrade-bundle-3.2.1.0.0.19801959.mub
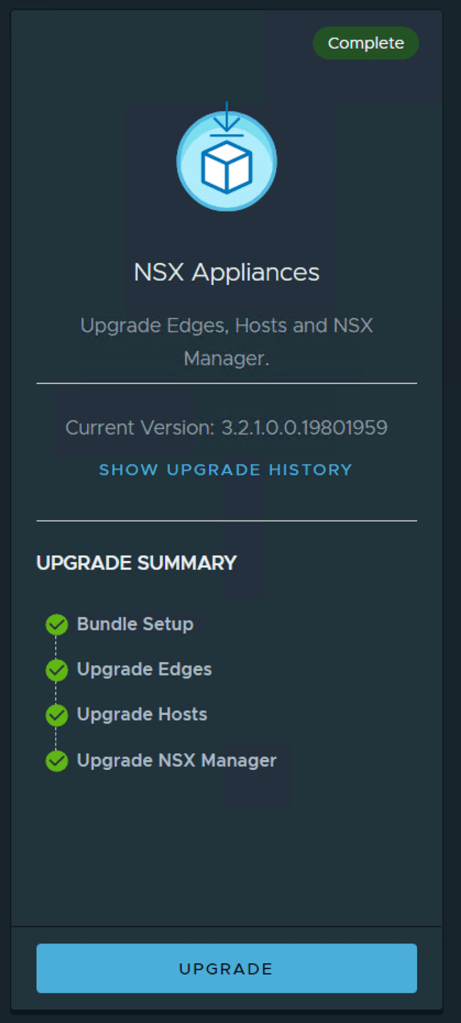
Step 1 – Access the NSX Manager Upgrade Portal
System -> Upgrade -> Upgrade under NSX Appliances
Step 2 – Upload the upgrade package
Bundle Setup -> Upload MUB File -> Browse to the upgrade file to import -> Upload
The upgrade package is roughly 8GB so depending on your environment, it could take some time to upload the file to the NSX Manager.
Upgrade Bundle retrieved successfully
Step 3 – Click Prepare for Upgrade
NOTE: System will be prepared for Upgrade and once it is done you can upgrade your Edge, Hosts and Management Nodes individually.
Accept the End User License Agreement
The extraction process does take some time – during this process the upgrade Coordinator is upgrade too.
Step 4 – Click Next at the bottom right.
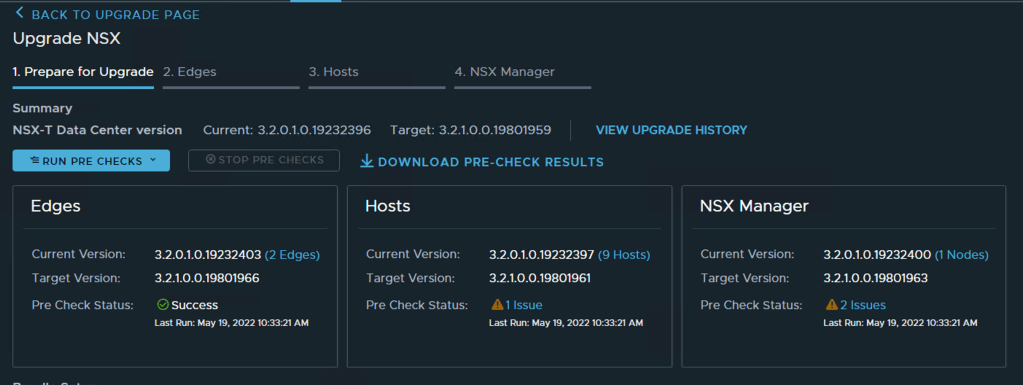
We can see from the dashboard that I am are currently on 3.2.0.1 and upgrading to 3.2.1.0
Step 5 – Run Pre Checks
Once the Pre Checks have completed, see if you have any warnings or anything that would prevent you from upgrading
I have one issue under my hosts, this cluster only has one ESXi Server and I don’t have DRS enabled. Since it is a critical error, I will pop over to vCenter and enable DRS even though its only a single host cluster – just to clear the errors.
I enabled DRS on the cluster from vCenter and ran the pre checks again selecting the hosts only option.
The NSX Manager now detects that there is only one host in the cluster gives me this warning – I powered off the workloads on this server to avoid the upgrade failing.
I have 2 issues highlighted on the NSX Manager. The first is warning me about the last time a configuration back up was done and the other recommends running the NSX Upgrade Evaluation tool which I have done at the start. So I will just ignore these.
After checking all the issues raised Click Next on the bottom right
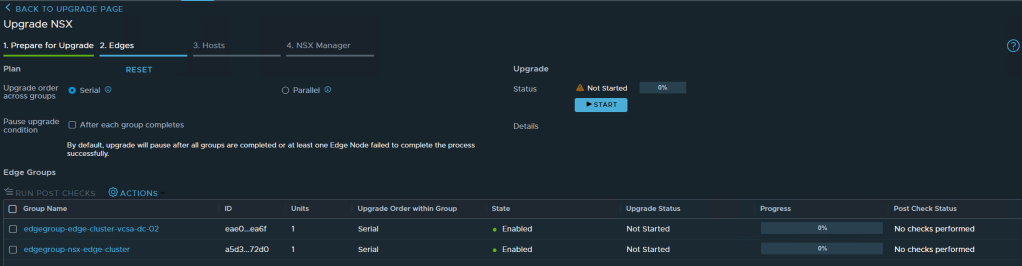
Step 6 – Upgrade Edge Nodes
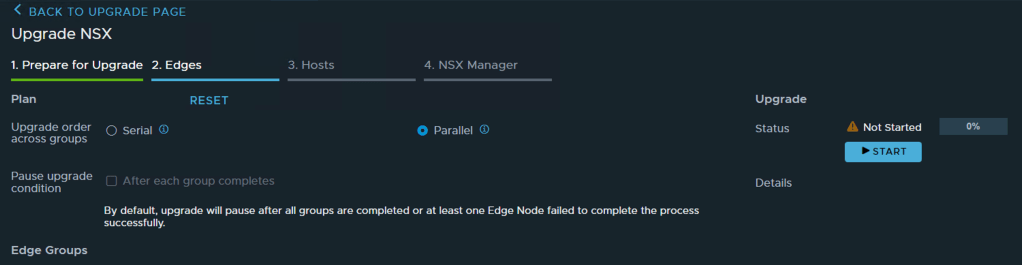
The Edge Nodes can be upgraded in Serial or Parallel – depending on your environment and deployment you will need to work out what would makes sense for you.
I am going to select Parallel so that both my edge clusters get upgraded at the same time
Note: Edge VM’s within the same cluster will be upgraded in serial with this option
Serial UpgradeParallel Upgrade
Select your preferred option and click Start
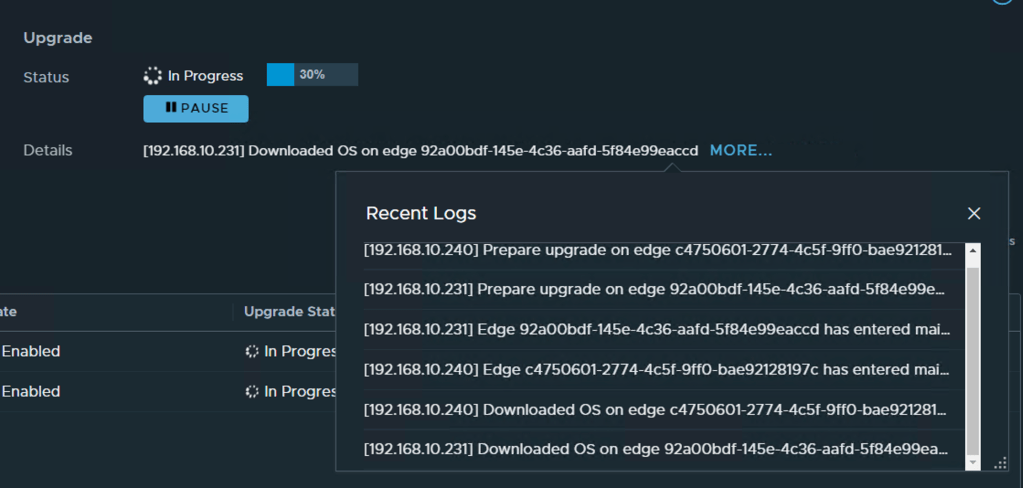
You can click on details and monitor the upgrade process
Once all the Edge Nodes are upgraded -> Click Run Post Checks
After the Post Checks are done Click Next on the bottom right
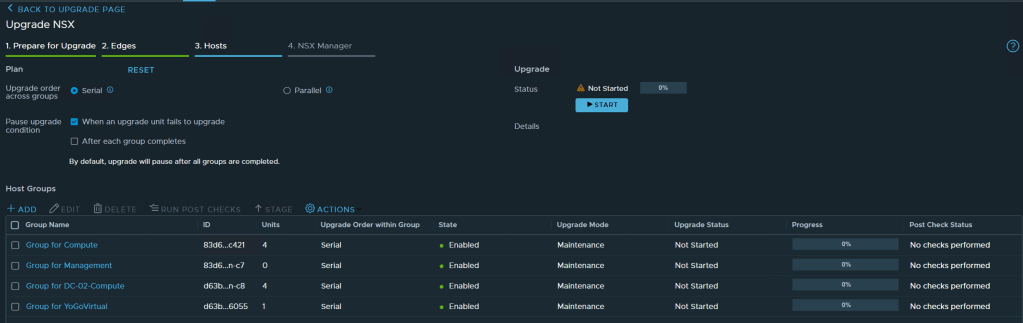
Step 7 – Upgrade Hosts
The hosts have the same options to upgrade in serial or parallel, you have some options to change the order in which clusters are upgrade too at the bottom. Again depending on your environment this order might differ from the details list in NSX Manager.
Select the preferred option, I am going to select serial here and let NSX Manager proceed with the upgrade.
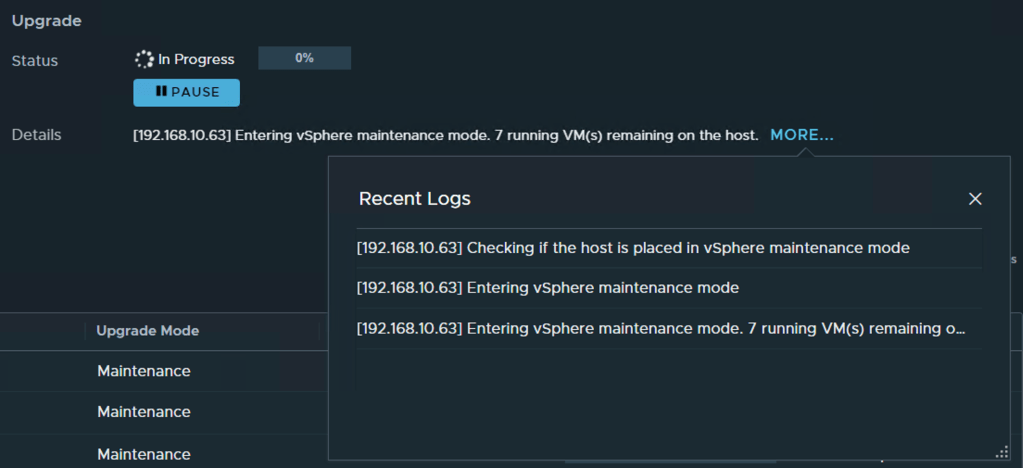
One you have selected all the options Click Start. During the host upgrade, hosts are placed in maintenance mode so any active VM on these hosts would be migrated to another host.
As the upgrade proceeds across all clusters, you can see the progress per cluster by selecting the cluster in Host Groups.
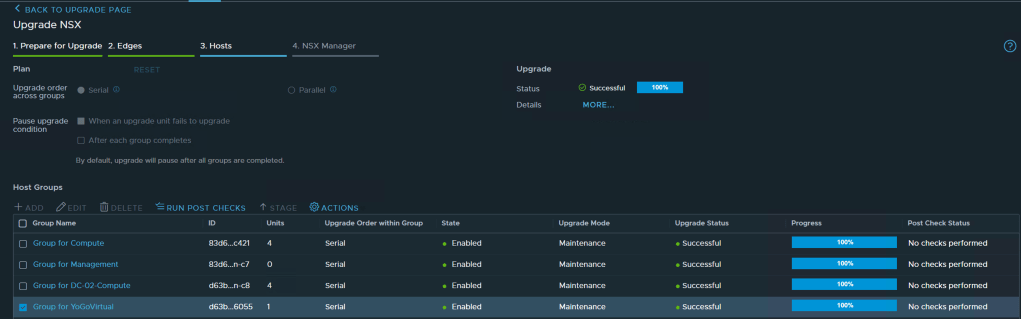
Once all the clusters/hosts have been upgraded you can run the Post Check -> Click Run Post Check
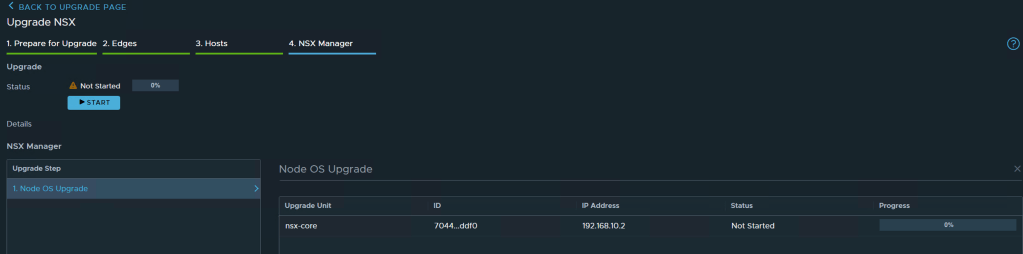
Step 8 – Upgrade NSX Manager
The final step in the upgrade process would be to upgrade the NSX Manager(s). My setup has a single manager so only one needs to be upgraded.
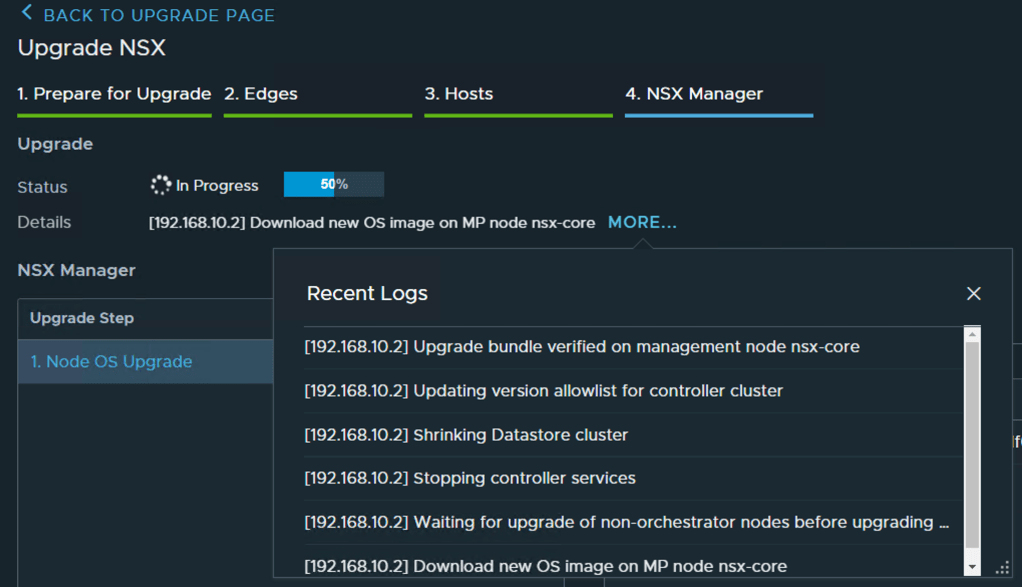
Click -> Node OS Upgrade -> Click Start -> Confirm to start the upgrade now.
This would take some, monitor progress on the right in the progress meter or follow the logs next to the Details line, click more to expand the logs.
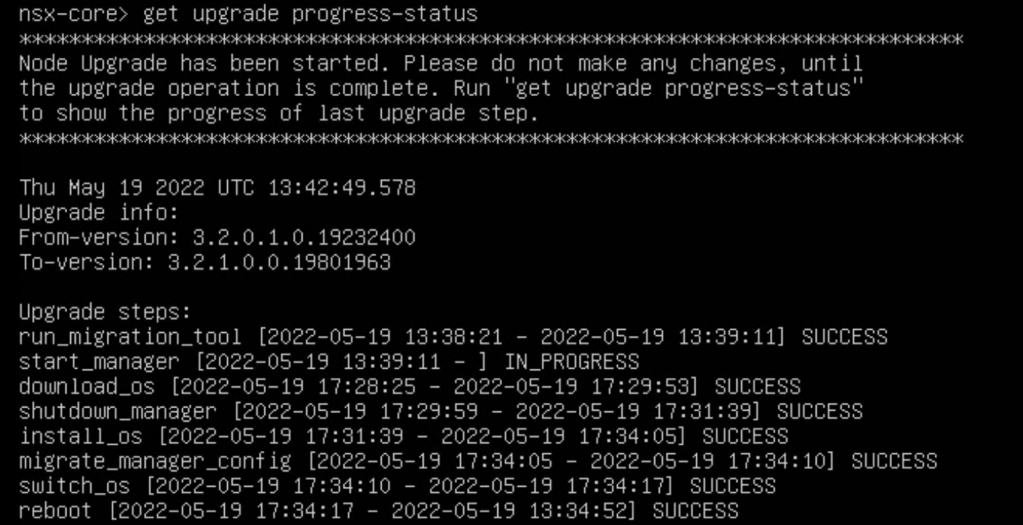
At some stage in the upgrade I lost access to the Manager, assuming this is durning the reload. I waited a few minutes and accessed the Manager. You can monitor the status from the CLI too.
Once the Manager has fully started up all the needed services, you can return to the upgrade tool and check the status of the manager up. Status should be Successful and Progress should be 100%.
Click ->Done
Upgrade Complete
Now that all components have been successfully upgraded from 3.2.0 to 3.2.1, I wanted to confirm that the TLS Inspection feature and Gateway IDPS is now available. Prior to the upgrade these dashboards had a banner stating it that these features were Tech Preview.
Summary
The upgrade process was pretty simple and easy to follow using the upgrade tool. Once the upgrade completed, it did take some before I could successfully access the dashboard but everything cleared fine.
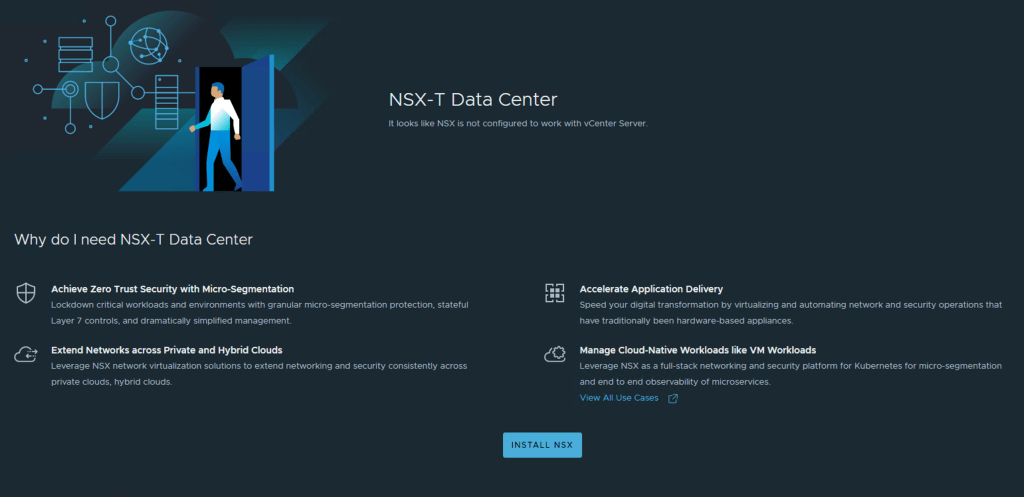
In this blog post I will cover NSX-T UI integrated with vCenter introduced in NSX-T 3.2.0. This feature allows the VI admin deploy the NSX Manager from the vCenter UI and then do NSX Networking and Security configurations from the vCenter UI. I will focus on the Security use case.
In my previous post I covered a similar topic – VMware NSX Switch Agnostic Distributed Security but it was focused on doing all the configurations via an NSX-T Manager using the NSX Deployment wizard of NSX-T for common use cases.
NSX-T UI Integrated in vCenter – NSX-T can now be installed and configured via the vCenter UI with the vCenter plugin for NSX-T. This feature is supported ONLY from vCenter 7.0U3 onwards.
As a VI admin, you can install NSX Manager and NSX-T for virtual networking or security-only use case. The Virtual Networking deployment workflow includes both networking and security use cases. In contrast, if you choose to configure Security Only type of deployment, then you cannot configure virtual networking on the selected cluster hosts.
Prerequisites
The feature was introduced with vCenter v7.0.3 but does work with hosts which are at least compatible with vCenter v7.0.3 and workloads need to be attached to dvportgroups on a VDS 6.6 or later.
Ensure that ESXi host version is compatible with vCenter Server version v7.0.3.
Ensure that vCenter Server version is v7.0.3 or later.
To provision a thick disk, ensure the disk size on host has at least 300GB free space.
Configure a vSphere Distributed Switch (VDS) switch on hosts. Only VDS 6.6 or later is supported.
Ensure vCenter Server points to an FQDN address and the DNS server must be able to resolve the address.
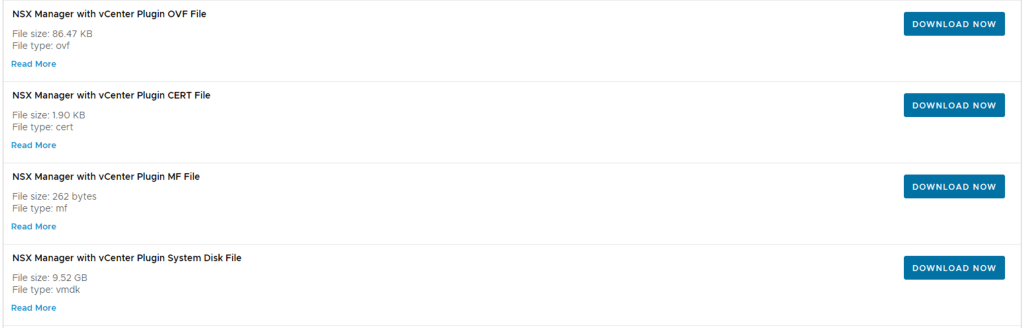
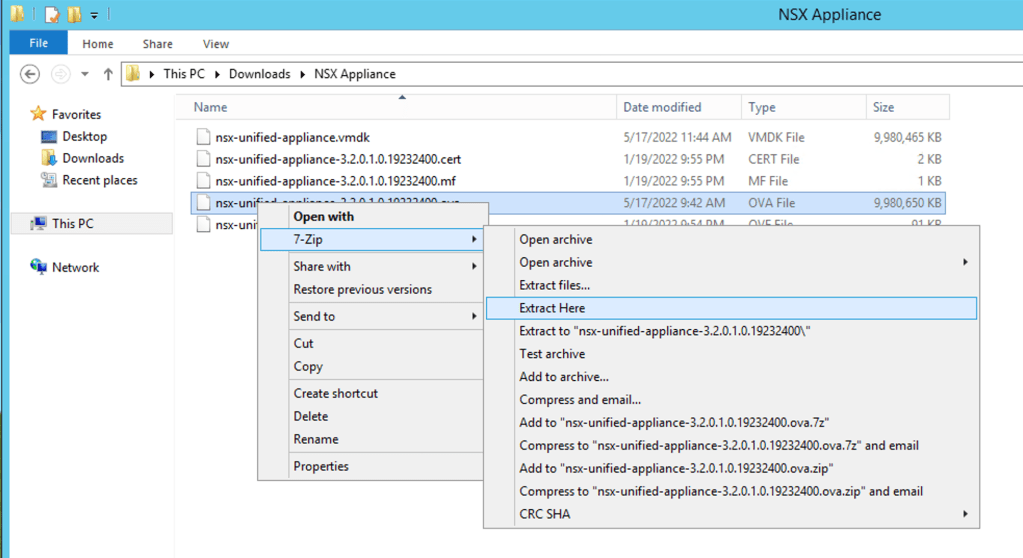
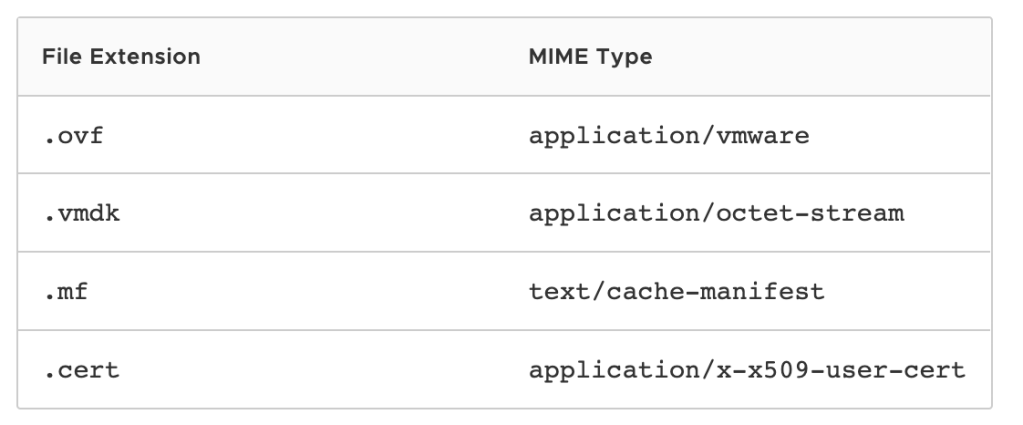
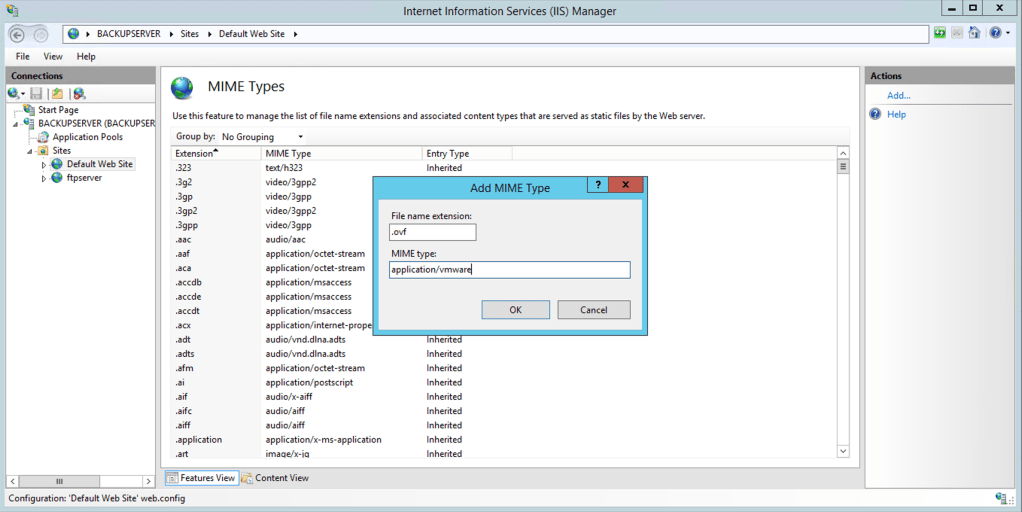
NOTE: When deploying the NSX-T Manager from vCenter you need to download these specific files from VMware download page. “There is a separate OVF file available for NSX Manager deployed from vSphere Client.”
NSX Manager with vCenter Plugin OVF File
NSX Manager with vCenter Plugin CERT File
NSX Manager with vCenter Plugin MF File
NSX Manager with vCenter Plugin System Disk File
NSX Manager with vCenter Plugin System Disk File Secondary
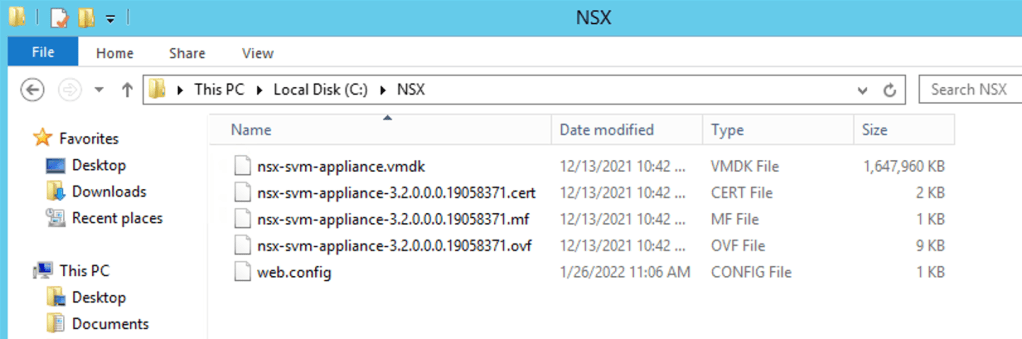
If you downloaded the complete OVA package you could use a tool extract the contents of the OVA and extra these files. I used 7-Zip.
NOTE: In NSX-T Data Center 3.2, only a single NSX Manager cluster is supported.
The deployment involves only deploying a single NSX-T Manager and therefor you should make sure to take a configuration back-up of the NSX-T Manager configuration and rely on vSphere High-Availability to protect the NSX Manager VM.
Workflow
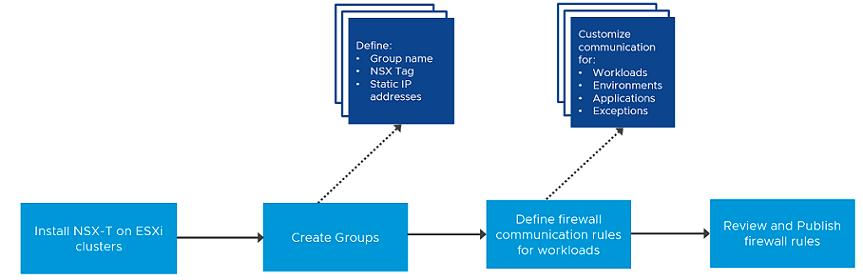
The workflow has a few simple steps to get from zero to Hero!
Configuring NSX-T for Security from vSphere Client Workflow
I have a simple setup which I will focus on how to get the NSX Manager deployed and run through a basic Firewall rule creation process.
Demo Topology
My demo setup consists of the following components and versions
vCenter virtual Appliance – Version 7.0.3.00600, Build number 19717403
VMware ESXi, 7.0.3, 19482537
VDS – Version 7.0.3
NSX-T Manager: Version 3.2.0.1
Before proceeding make sure you have the files mentioned above ready and accessible.
NSX Manager Deployment
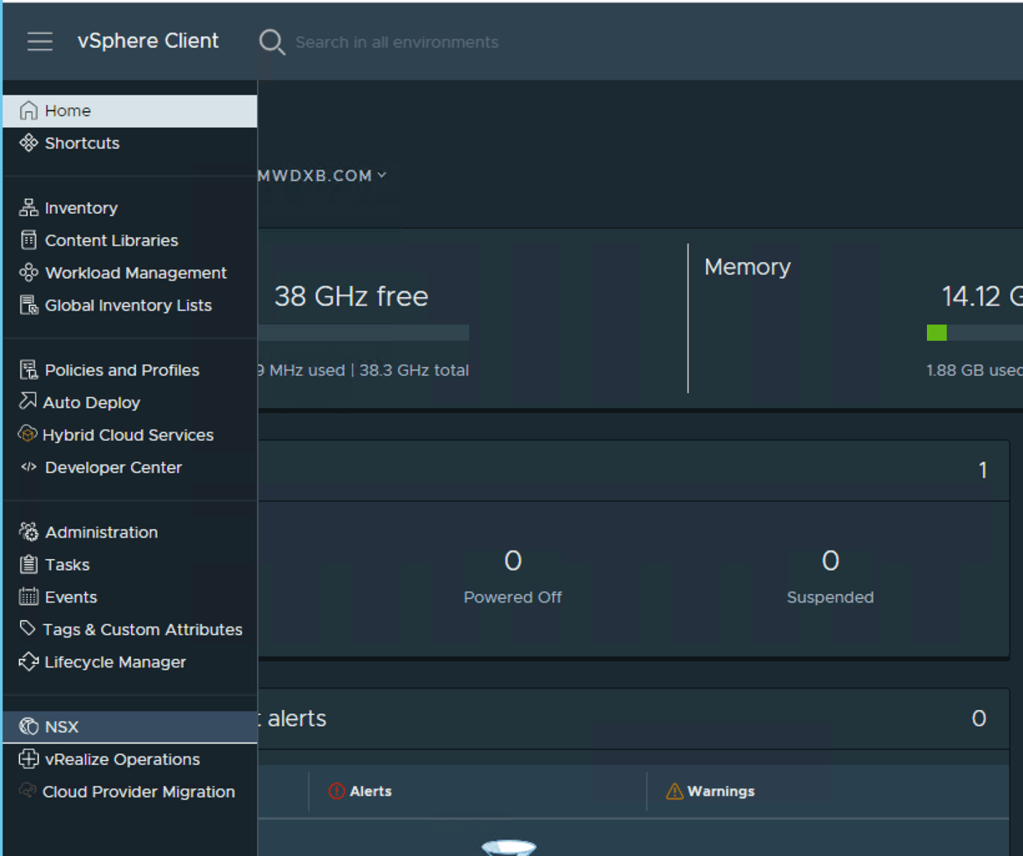
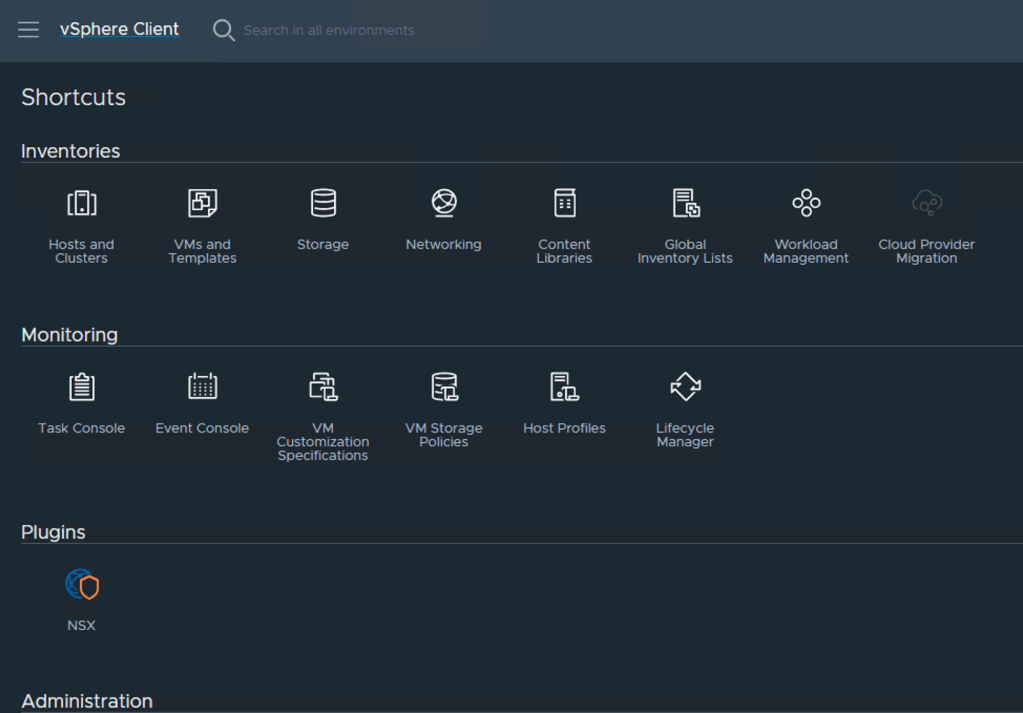
Step 1 – Lets start -> vCenter UI -> Home -> Drop menu -> NSX
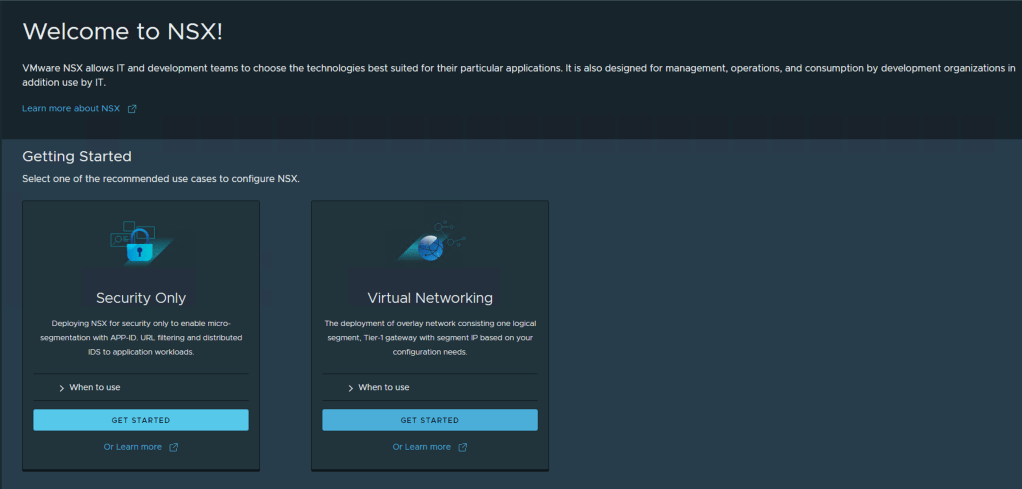
At this point you would have decided if you are going to deploy the full stack NSX which includes Network and Security or Security only – I am covering the Security Use Case here
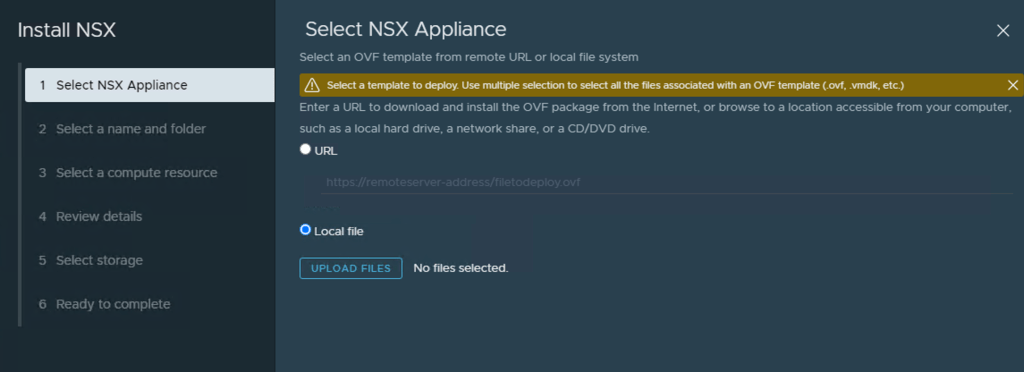
Step 2 – Click Install NSX
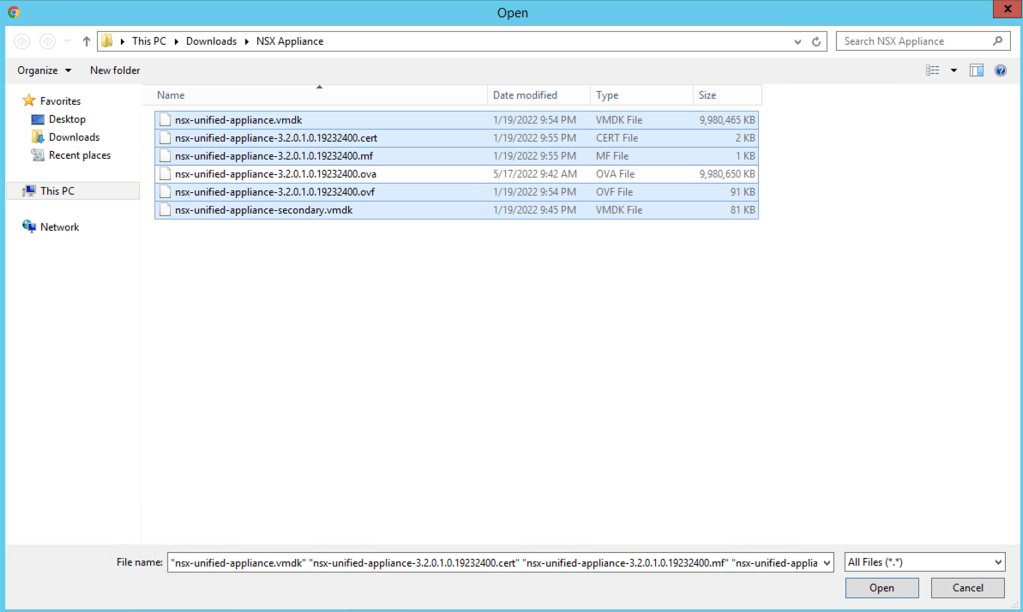
Step 3 – We need to locate the NSX Manager OVA file, either you published on a URL or you have it downloaded to your local machine. In my case, I have downloaded the OVA from VMware’s website and will follow that option. Click Local File
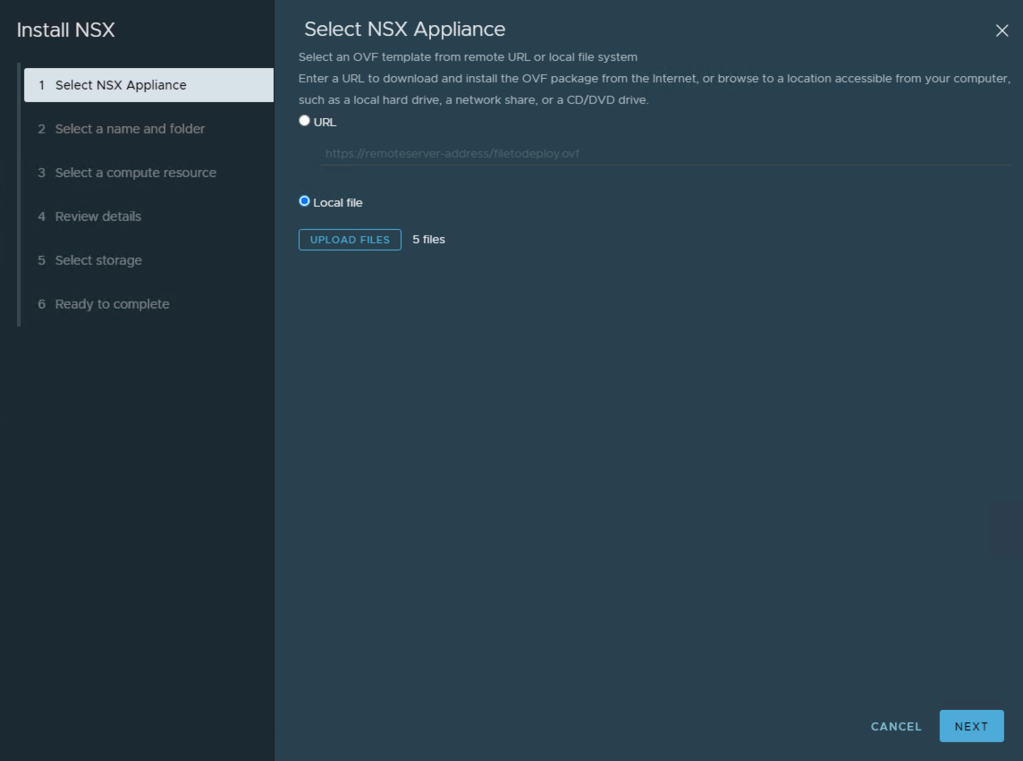
Then Click Upload Files and select the five (5) files and click Open. Below I have an additional file in my directory which was the OVA I dowloaded and just extracted to the contents to this local directory.
Now Click Next at the bottom Right
Step 4 – Now we need to specify the deployment details of the NSX Manager VM which will be deployed in vCenter – we will be deploying the NSX Manager on compute managed by the vCenter that we are integrating NSX-T too.
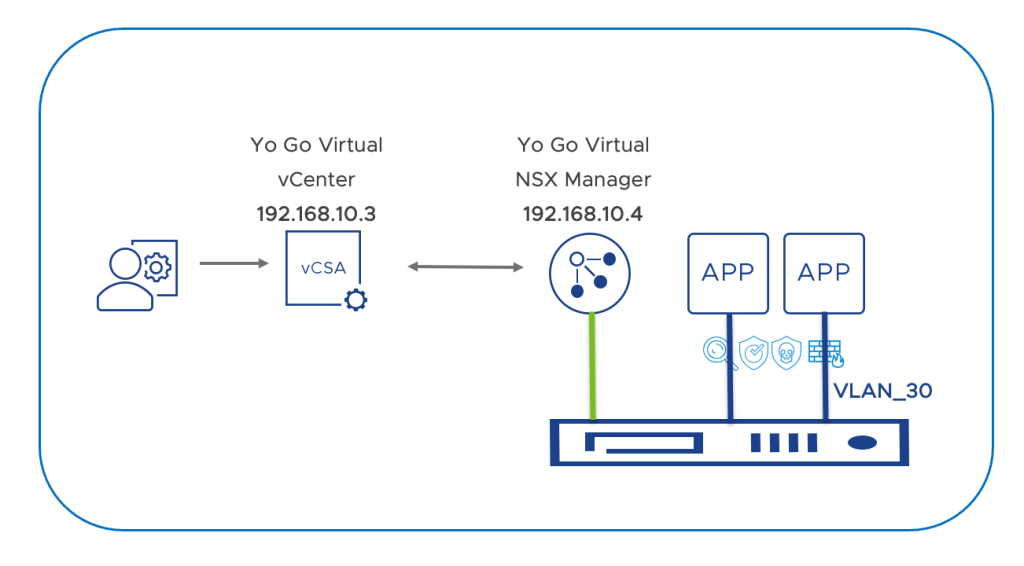
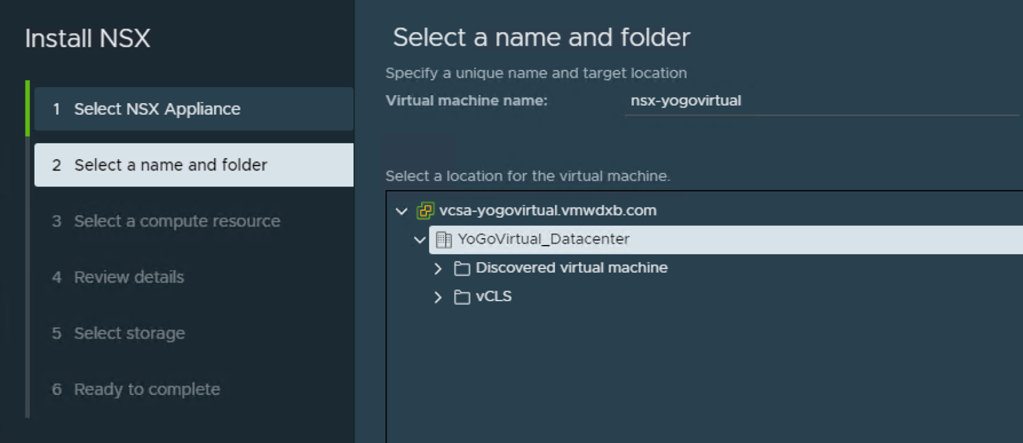
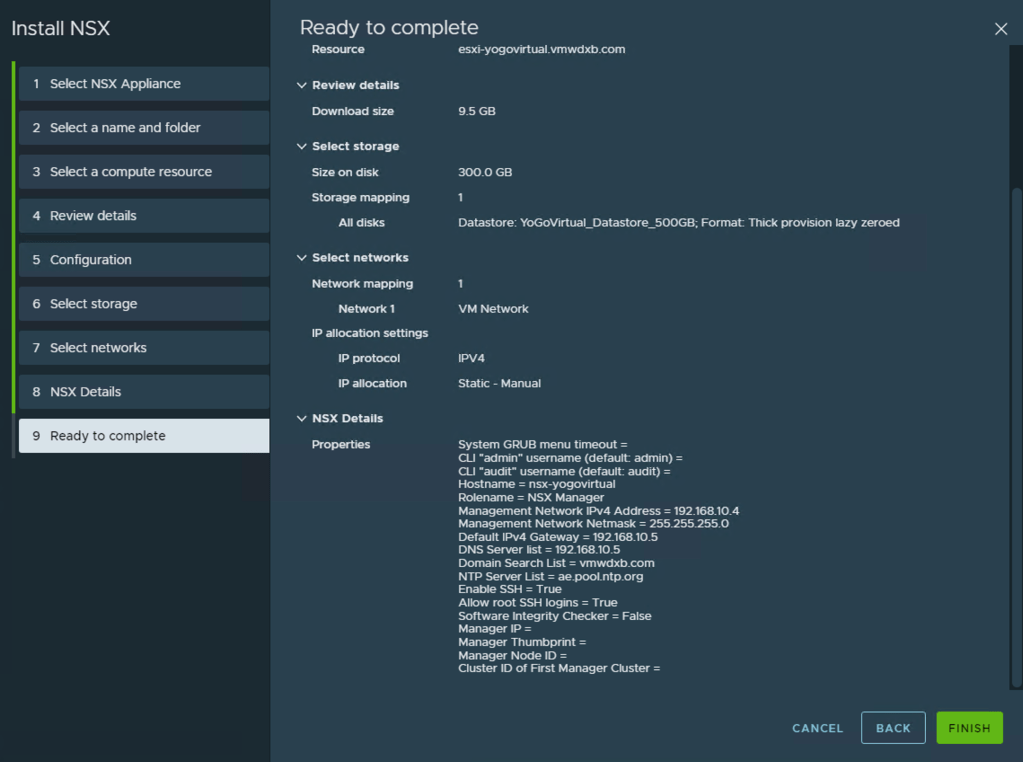
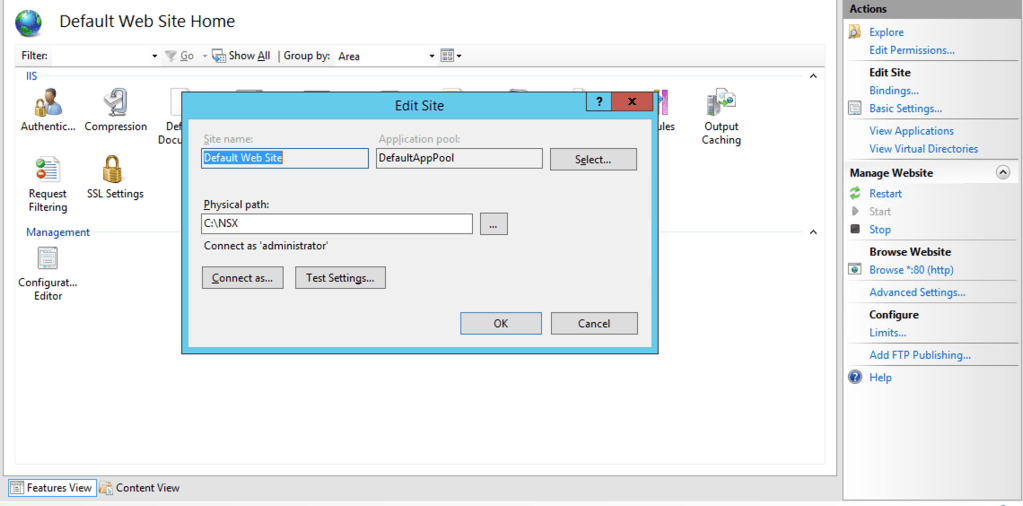
Select a name for NSX VM Manager VM and deployment location – I just named it nsx-yogovirtual. I created a DNS entry in my local DNS for the same and mapped it to the IP address I will be using in the next few steps. Click Next
Name and Deployment Location
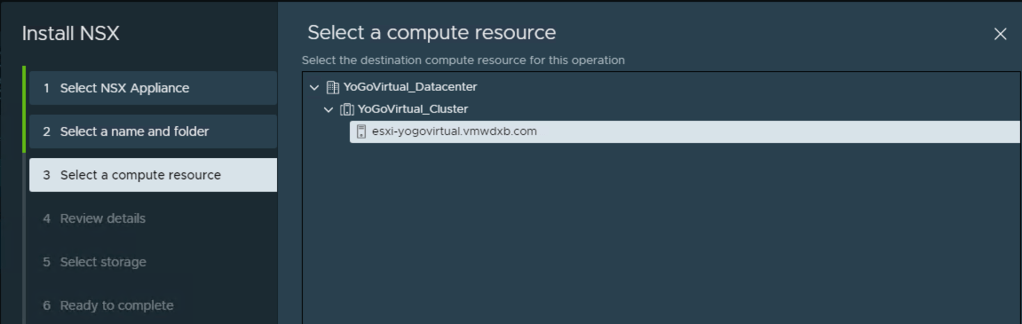
Select a compute resource – Click Next
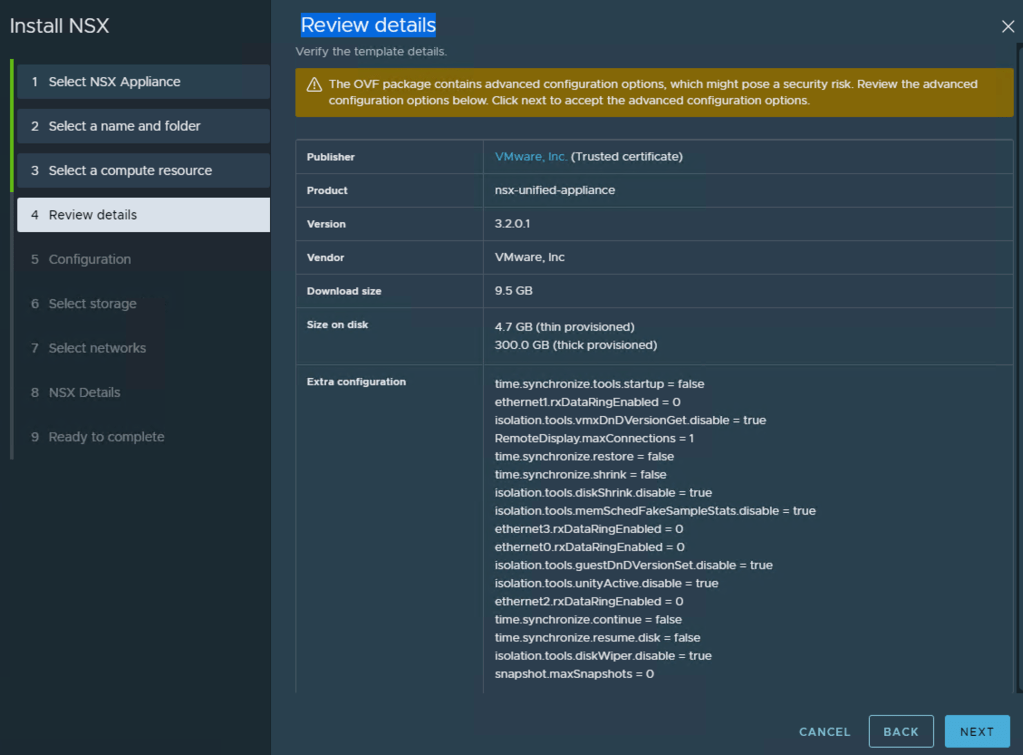
Review details – Click Next
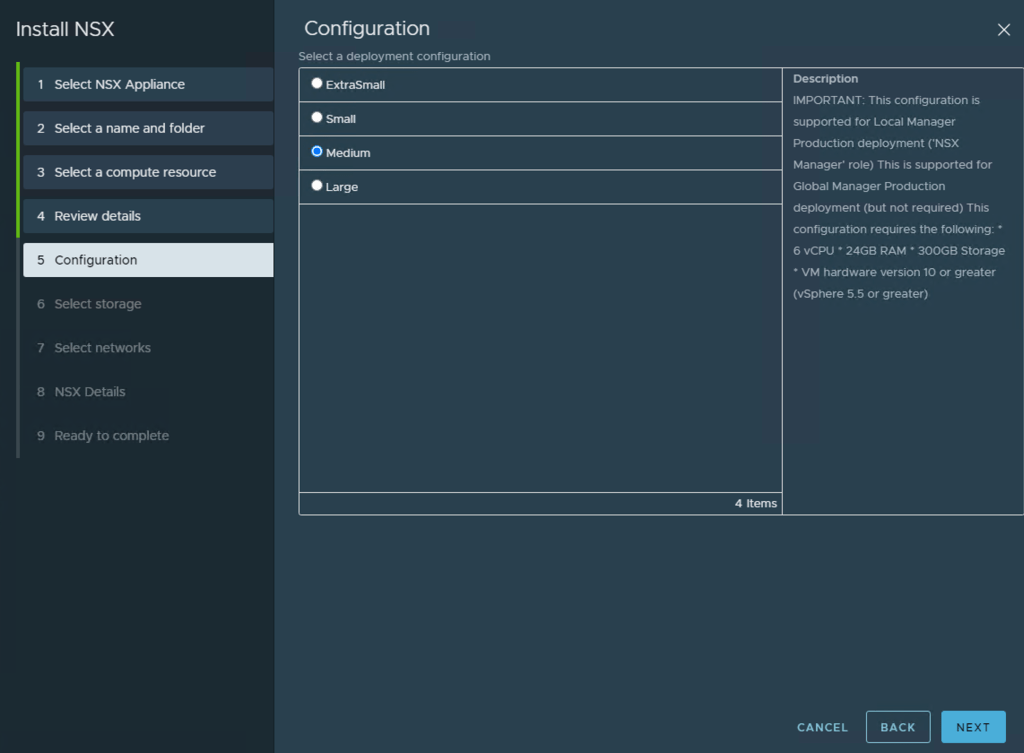
Configuration – Select the appropriate NSX Manager deployment configuration for your environment, I selected Medium. Click Next
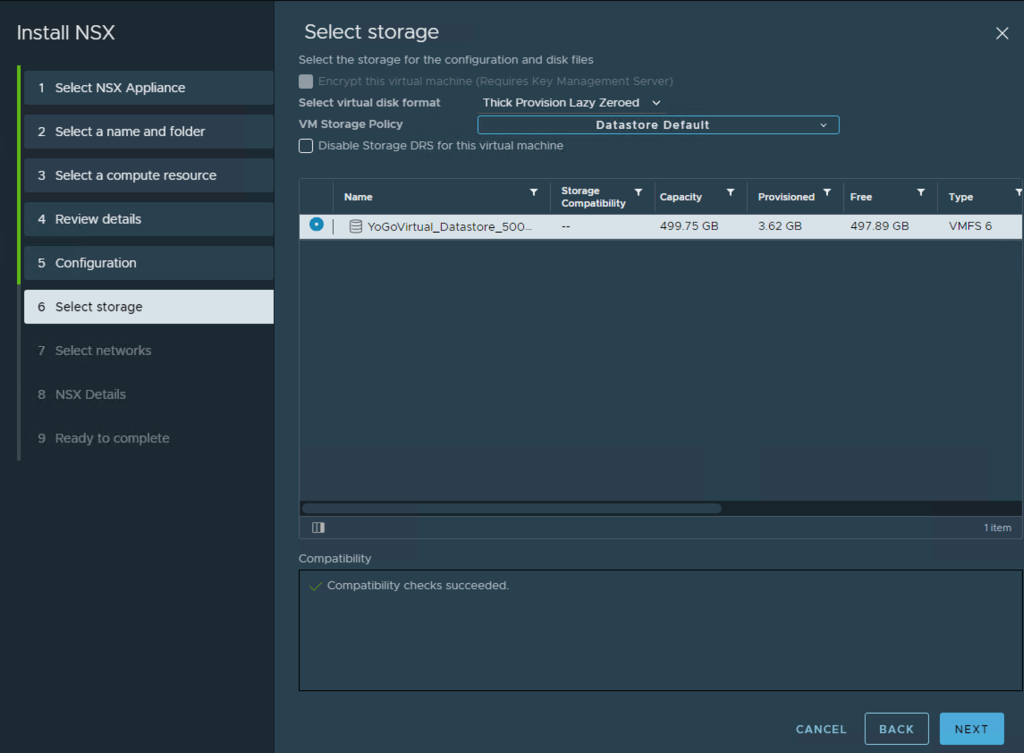
Select Storage – Select the datastore that you want the NSX Manager deployed too. Click Next
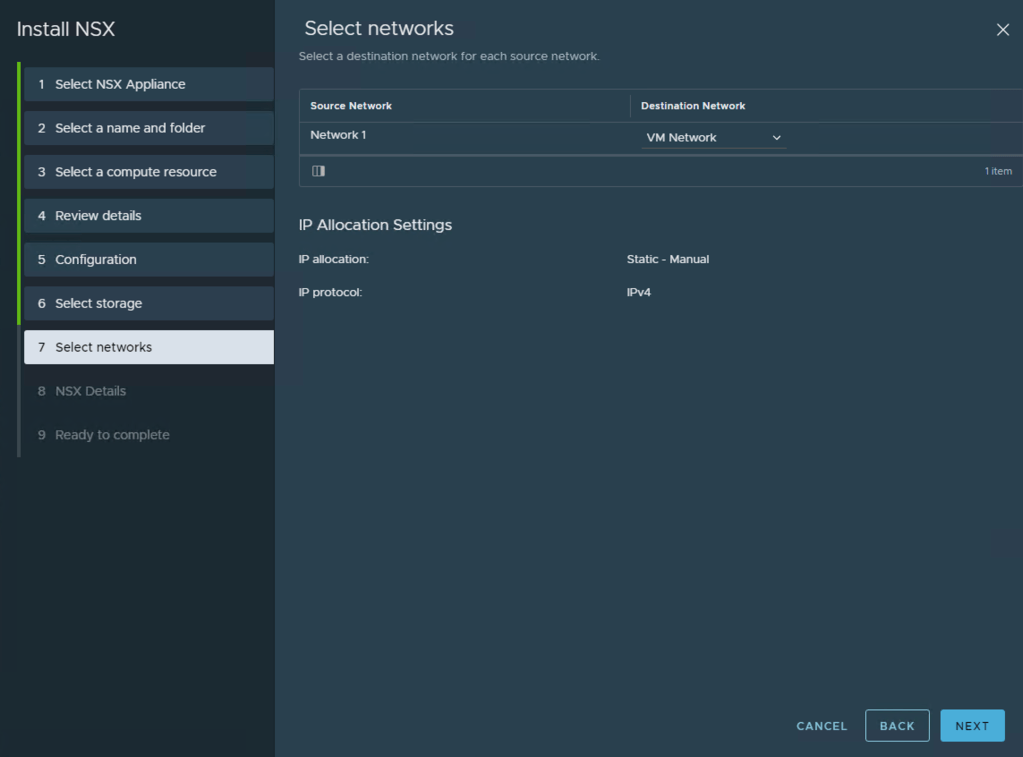
Select Networks – Below the Destination Network, click on the drop menu there and select the correct portgroup where the NSX Manager will be connected too – remember the NSX Manager needs to have reachability to vCenter and the ESXi hosts once deployed.
Once selected, click Next
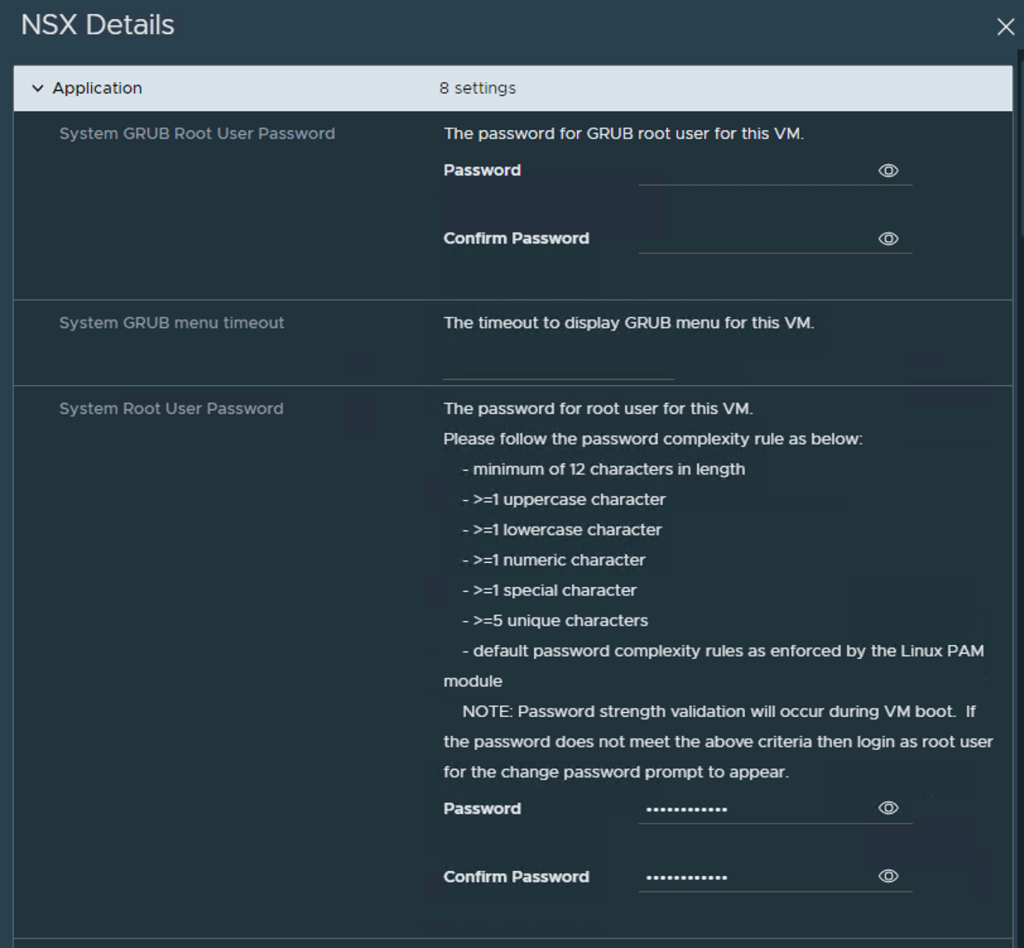
NSX Details – Now we need to configure both system root and admin passwords and then specify the IP details for the NSX Manager. The other settings are optional or can be ignored.
System Root User Password
The password for root user for this VM. Please follow the password complexity rule as below: – minimum of 12 characters in length – >=1 uppercase character – >=1 lowercase character – >=1 numeric character – >=1 special character – >=5 unique characters – default password complexity rules as enforced by the Linux PAM module
Enter the password under System Root User Password and confirm the password too.
Now enter a password CLI “admin” User Password
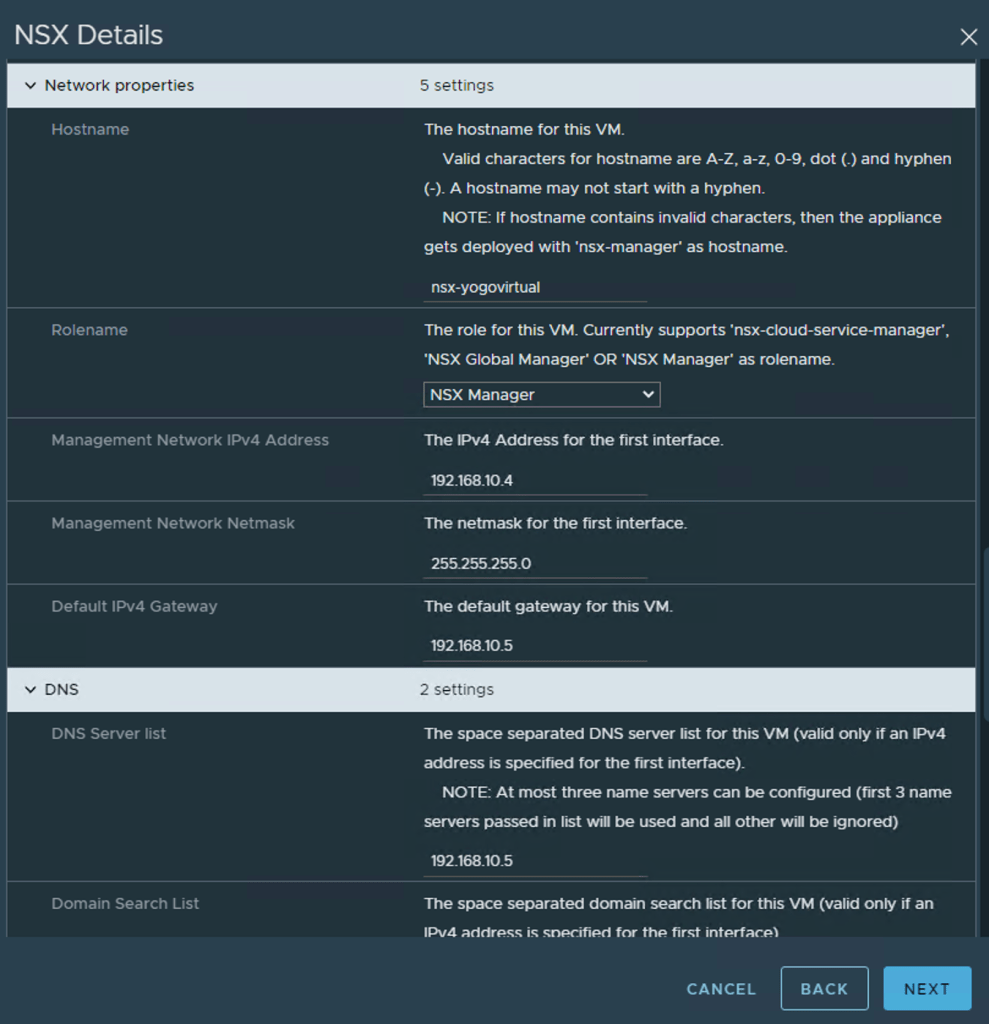
Now Move the slide bar on the right hand side down so that you can enter the IP address details.
Below is a list of all the details I populated, the rest are optional can be ignored.
Hostname: nsx-yogovirtual
Rolename: nsx-manager
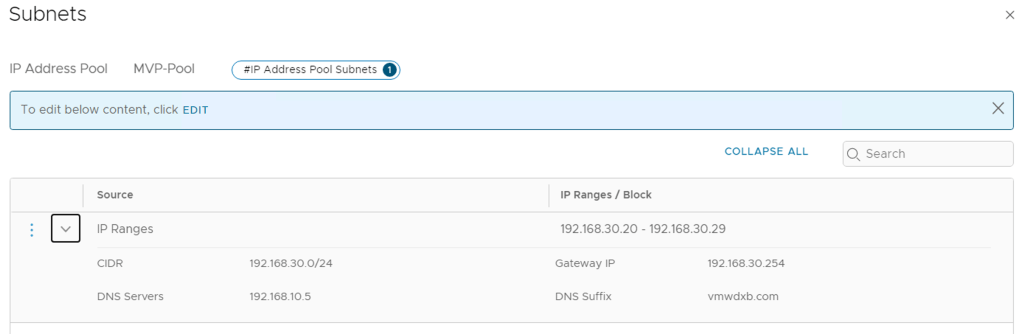
Management Network IPv4 Address: 192.168.10.4
Management Network Netmask: 255.255.255.0
Default IPv4 Gateway: 192.168.10.253
DNS Server list: 192.168.10.5
Domain Search List: vmwdxb.com
NTP Server List: ae.pool.ntp.org
Enable SSH: enabled
Allow root SSH logins: enabled
Once all the details have been populated, Click Next
Ready to Complete – Review all the settings and if everything is in order, Click Finish
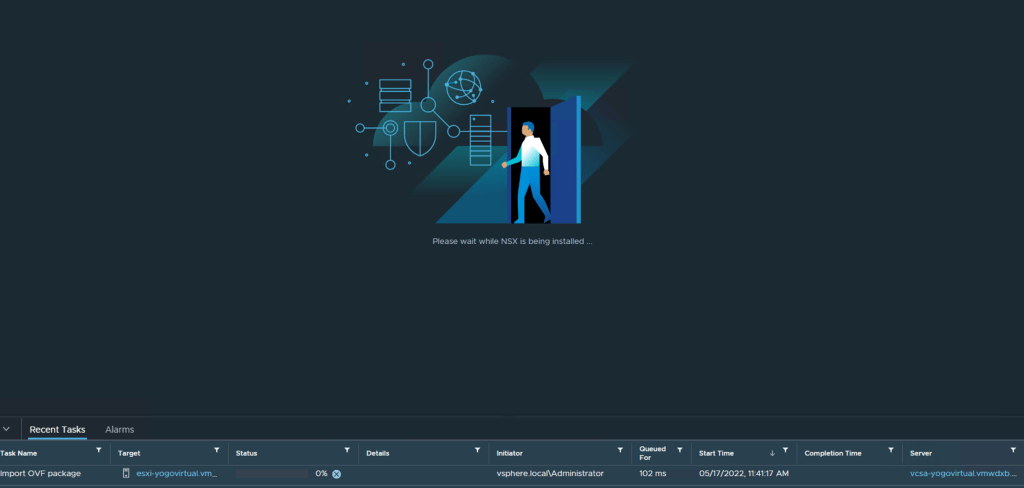
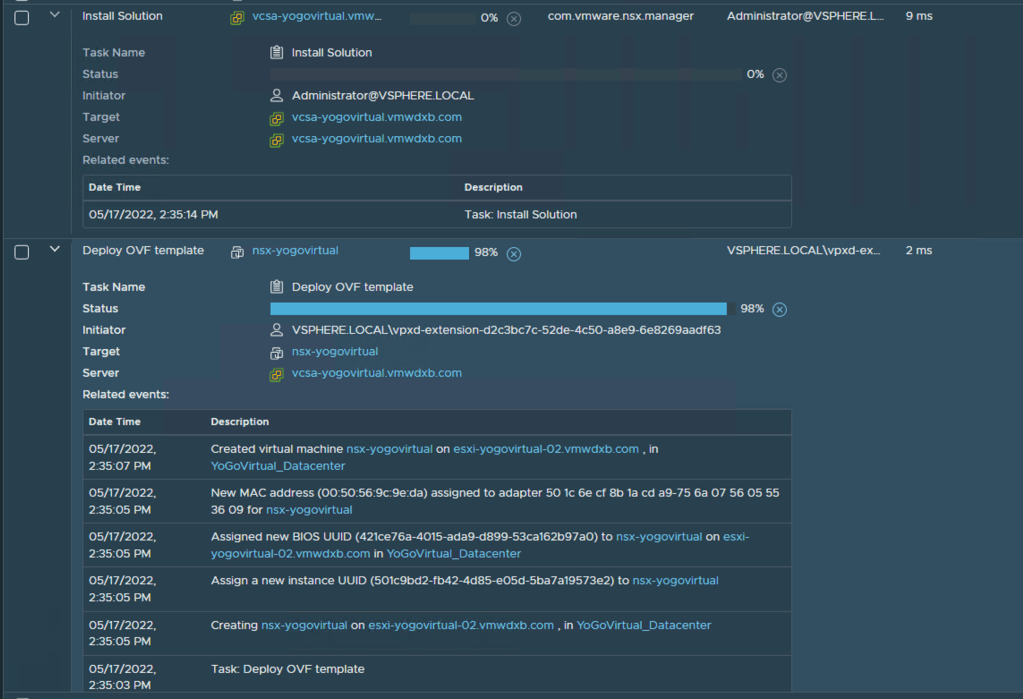
vCenter will now start creating the NSX Manager VM and importing the deployment package.
Monitoring deployment progress from Task Manager
Once the deployment has completed and the NSX Manager is powered on by vCenter and it will take sometime for all the services to start up.
Step 4 – Open a page to the NSX Manager UI and login with the admin user details and accept the agreement.
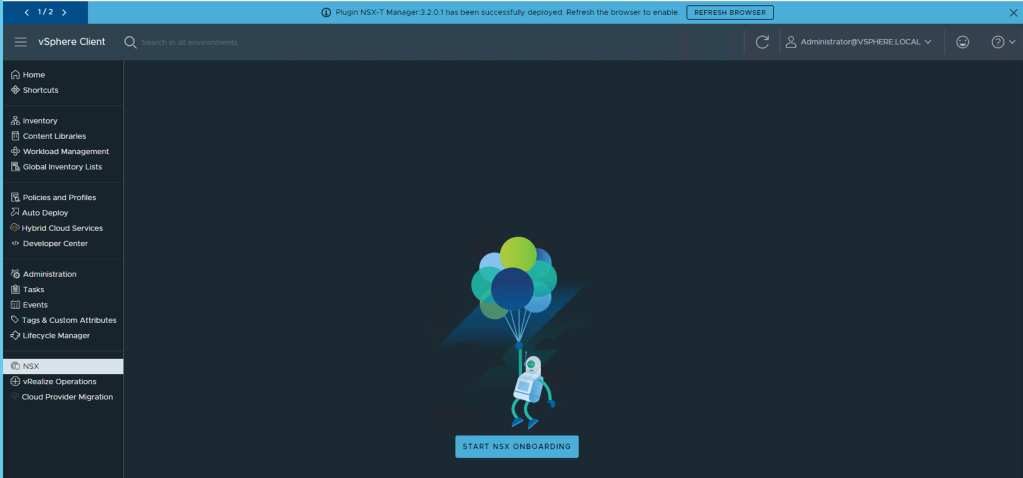
***I found that the VMware documentation was not 100% clear on this point and I noticed that my plugin pop-up only appeared once I done this step.***
Step 5 – From the vCenter UI under NSX -> Start NSX Onboarding and or refresh browser if you see this banner at the top of the page Plugin NSX-T Manager:3.2.0.1 has been successfully deployed. Refresh the browser to enable
Step 6 – Apply NSX license.
If you refreshed the browser and access the vCenter home page, you see the new NSX icon under plugins.
Deploying NSX
Once the license has successfully validated you need to select Security Only or Virtual Networking
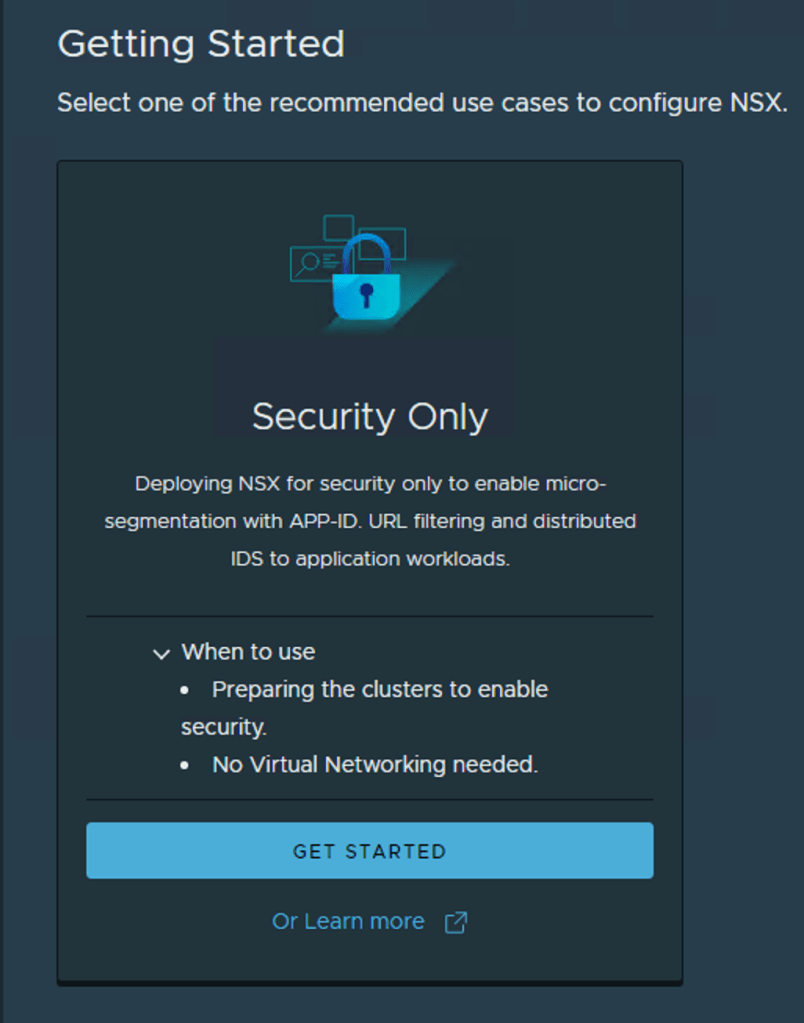
Since this blog is focused on Security, I am going to click Get Started under the Security Only option
Security Only
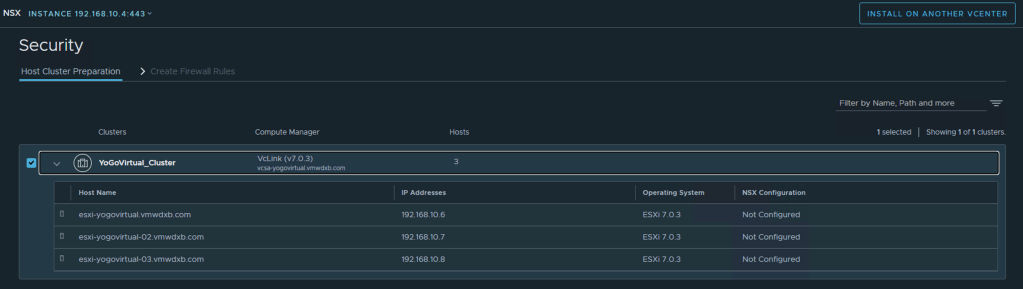
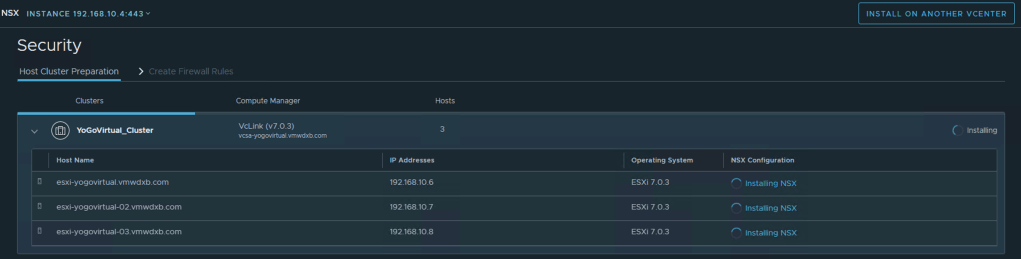
Select the vSphere Cluster where you want to have NSX Security installed and click Install NSX
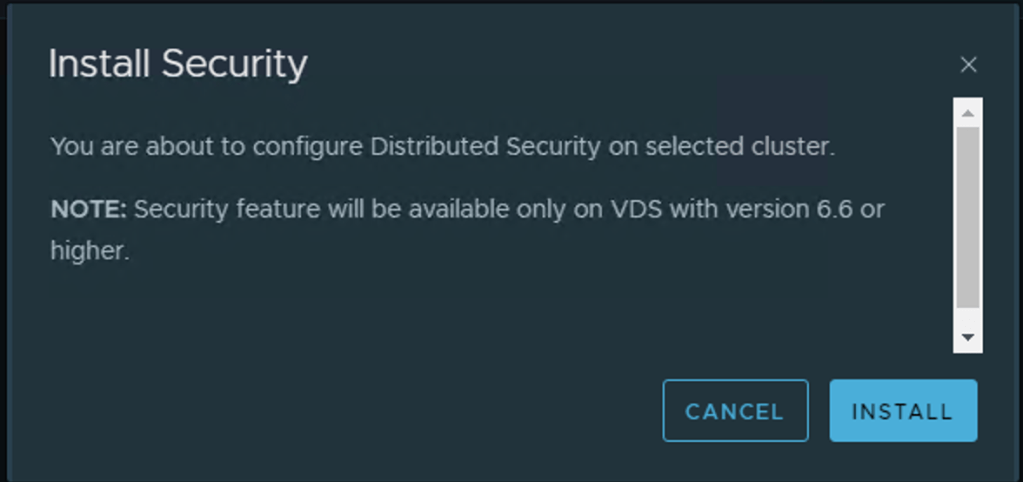
Install Security – Click Install
Monitor deployment in progress
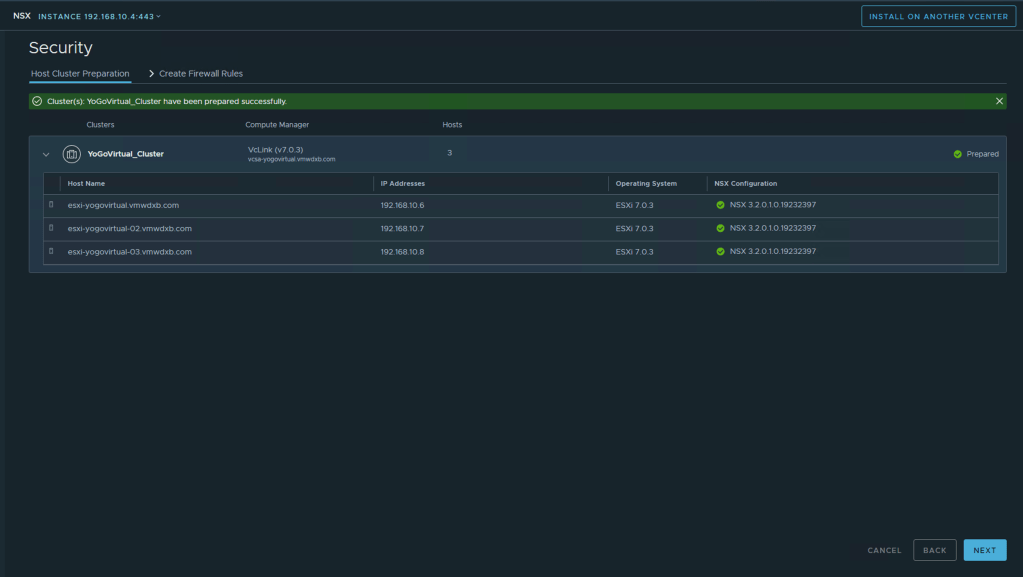
After successful host preparation and installation of NSX, you should see Cluster(s): YoGoVirtual_Cluster have been prepared successfully.
YoGoVirtual_Cluster have been prepared successfully.
Configuring NSX-T for Security from vSphere Client
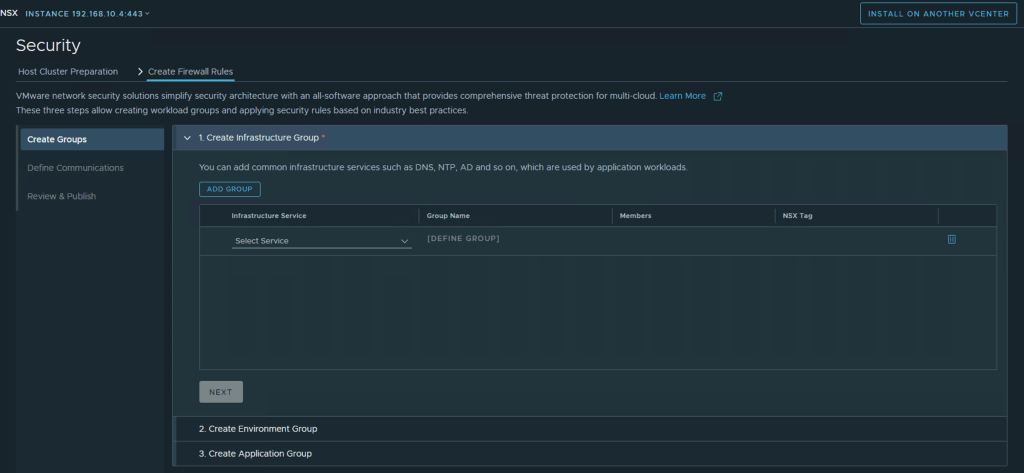
After complete the NSX installation on the ESXi hosts, we can now proceed with Firewall Policy creations, Click Next
Step 1 – Create Infrastructure Group(S)
You can add common infrastructure services such as DNS, NTP, AD and so on, which are used by application workloads.
Click Add Group -> Select Service from the drop down menu
Click Define Group -> Select VM(S) for the active directory service.
You can rename the default Group Name and NSX Tag if needed
My setup does not have any workloads yet so I just used the IP address for the AD Server which is outside this environment for demonstration purpose.
Step 2 – Create Environment Group -> ADD Group -> Select Environment -> Define Group
Create Environment Group
Select the VM’s in your environment that matches the selected Environment
Production
Development
Testing
Partner
Define Production Group
After selecting the VM’s to include in this group Click Save and proceed to Next
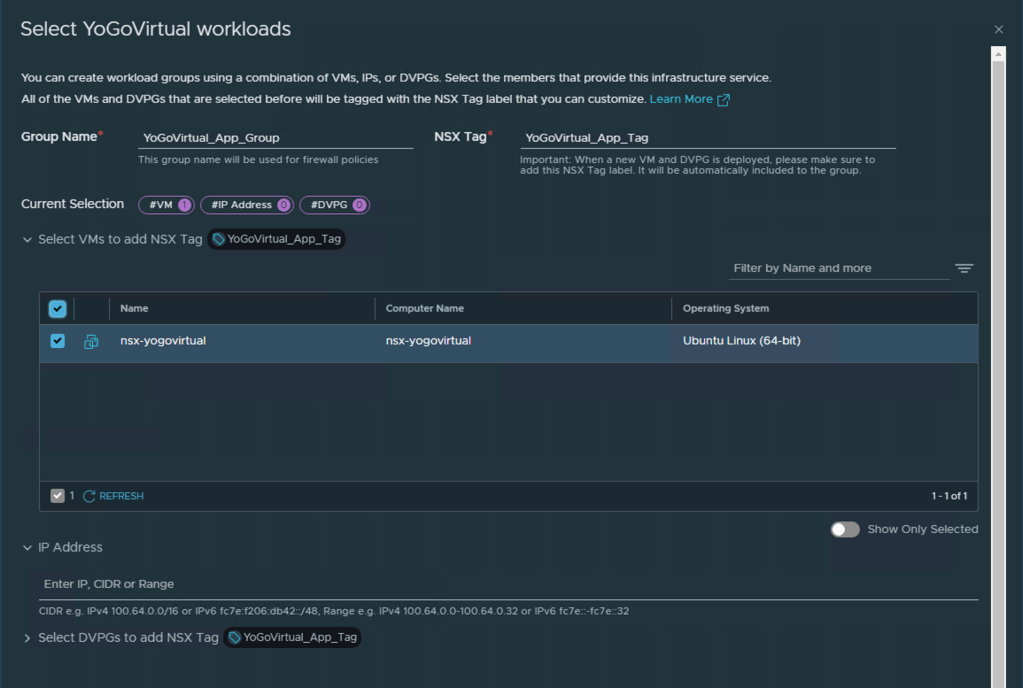
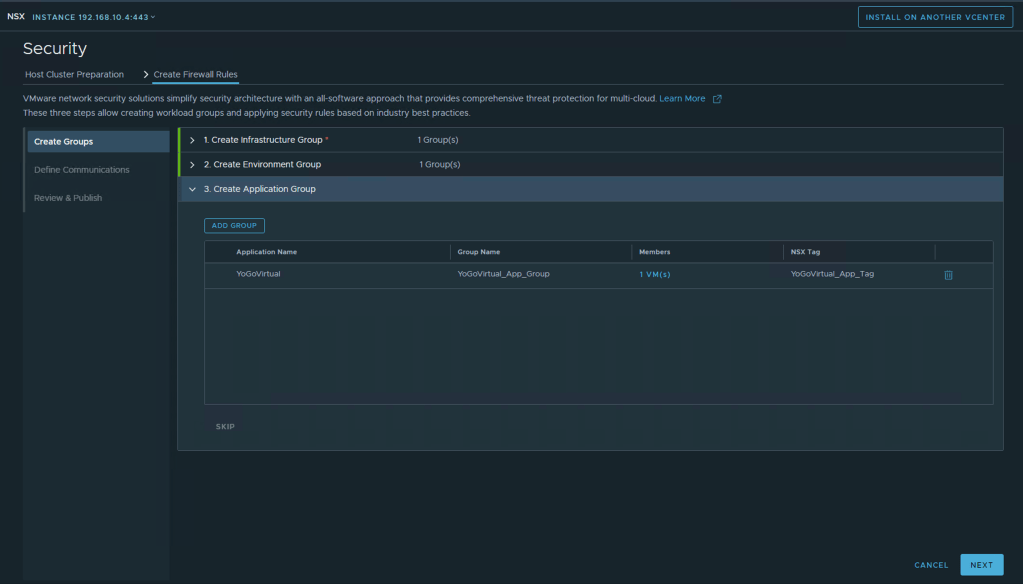
Step 3 – Create Application Group ADD Group -> Enter Application Name -> Define Group -> Select the VM’s and Click Save
Select YoGoVirtual workloads
Click Next
Security Policies
Next step would be to tweak the access for policy and environment created in the previous steps. Since I have no workloads in this environment besides my NSX Manager I am just going to leave all the suggest rules as is and just click Next, Next
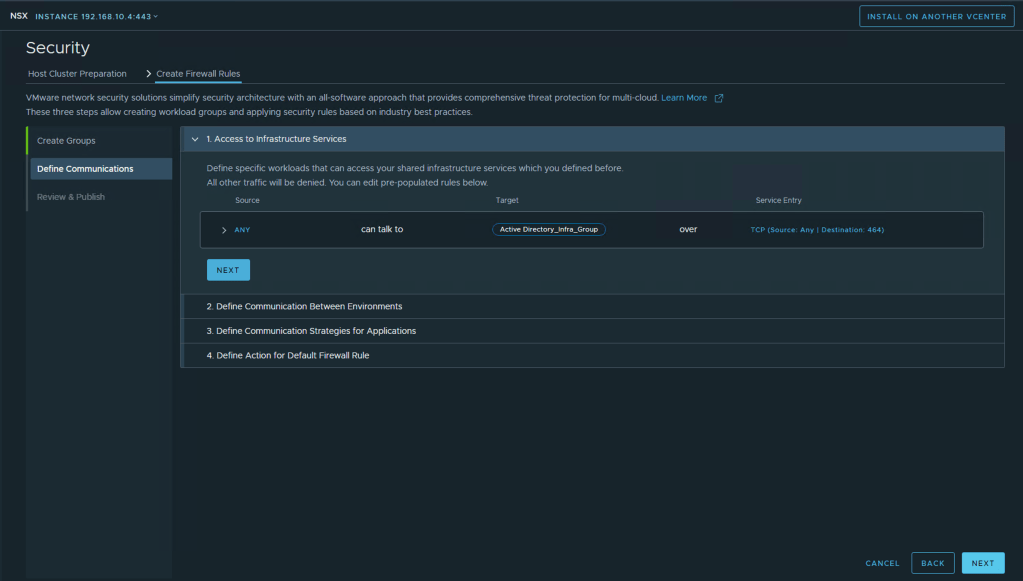
Define specific workloads that can access your shared infrastructure services which you defined before. All other traffic will be denied. You can edit pre-populated rules below.
Access to Infrastructure Services
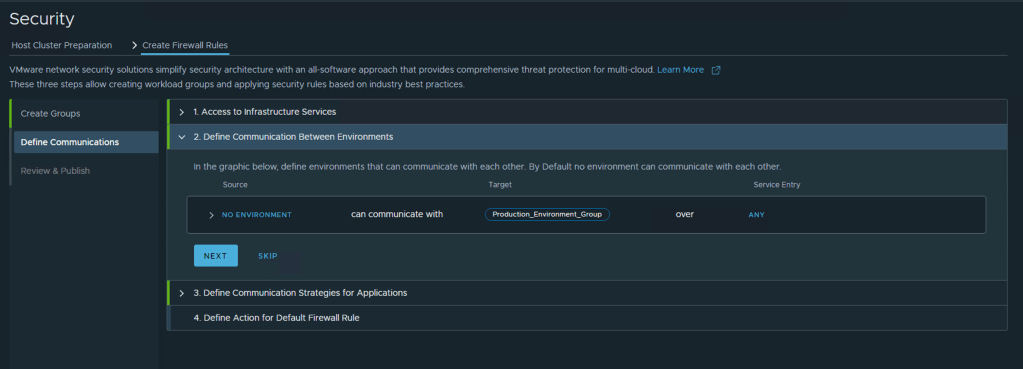
In the graphic below, define environments that can communicate with each other. By Default no environment can communicate with each other.
Define Communication Between Environments
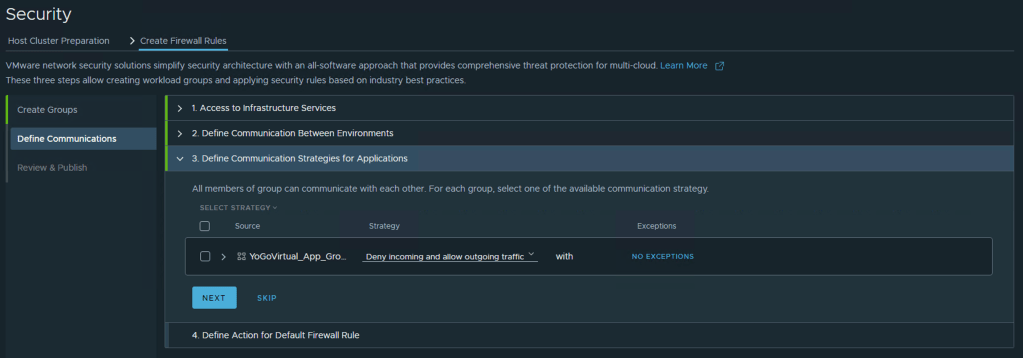
All members of group can communicate with each other. For each group, select one of the available communication strategy.
Define Communication Strategies for Applications
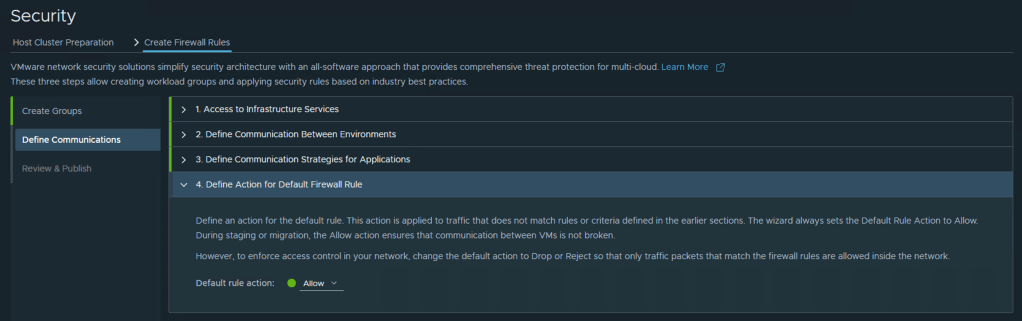
Define an action for the default rule. This action is applied to traffic that does not match rules or criteria defined in the earlier sections. The wizard always sets the Default Rule Action to Allow. During staging or migration, the Allow action ensures that communication between VMs is not broken. However, to enforce access control in your network, change the default action to Drop or Reject so that only traffic packets that match the firewall rules are allowed inside the network.
Define Action for Default Firewall Rule
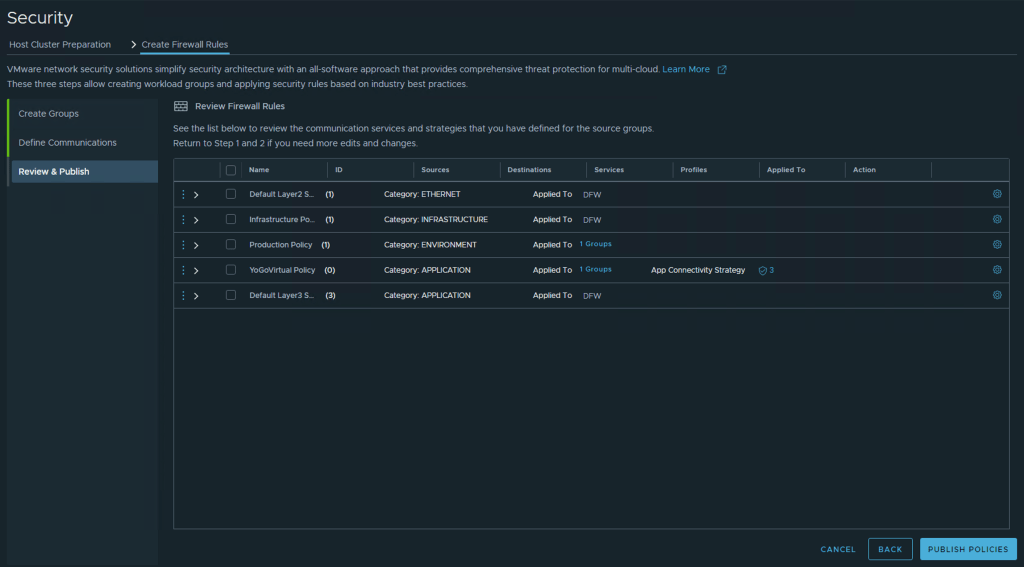
Review Firewall Rules
The final step is to review the Firewall Rules created and if everything looks good, go ahead and publish policies
Review Firewall Rules
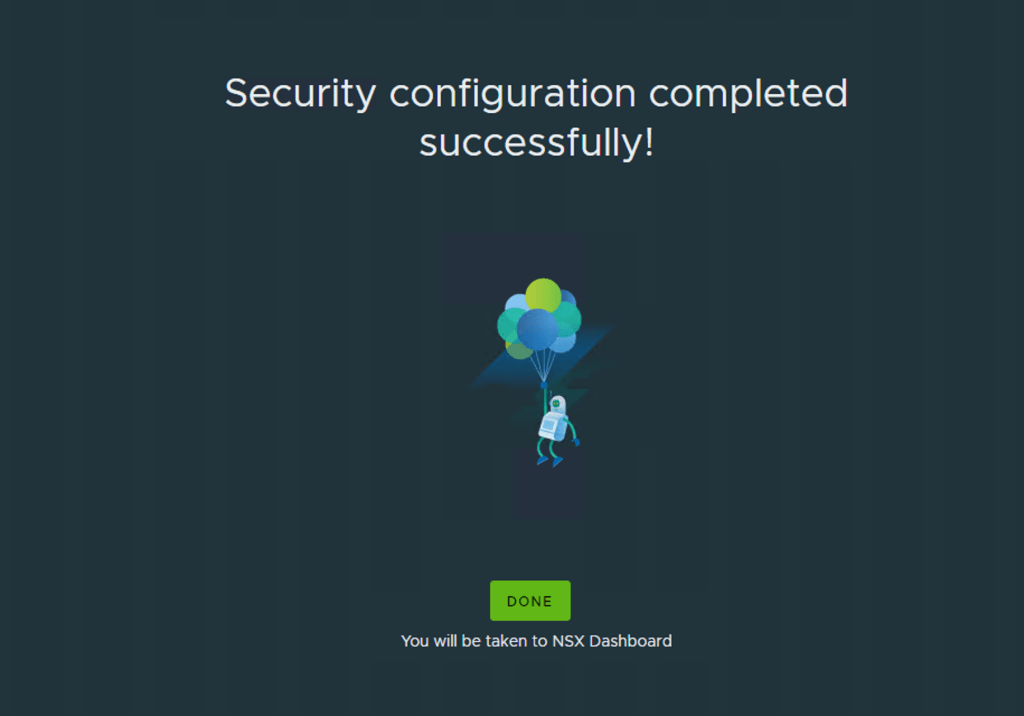
Once this has been completed yo have Security configuration completed successfully! Click Done
Once this has been completed and return to the vCenter home page and select the NSX plugin you will land on the NSX Manager page.
NSX Plugin
It will look and feel as if you have logged directly into the NSX-T Manager but instead its viewed and configured from within vCenter UI.
You can review the settings under the system page or do any further security configurations as needed.
NSX Fabric ViewDistributed Firewall Policies
Under Network -> Segments -> Distributed Port Groups you find all the dvportgroups NSX has discovered in the vCenter system and you can apply security policies to any workload attached to these
Summary
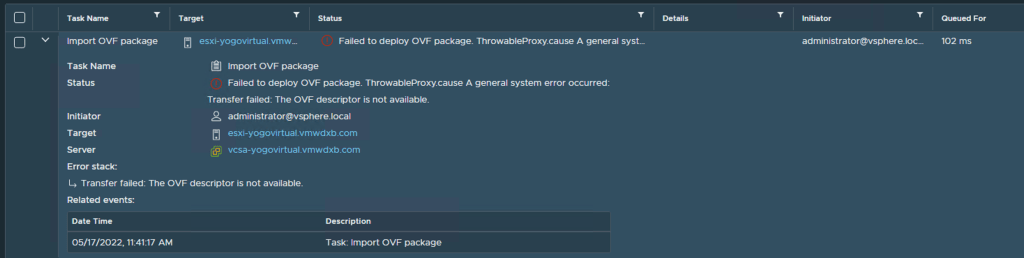
With my first attempt, the deployment failed with this error – Transfer failed: The OVF descriptor is not available. This was because I did not follow the documentation properly a missed the note that stated “There is a separate OVF file available for NSX Manager deployed from vSphere Client.” I was using the regular OVA package instead of the OVF and files as described in this blog.
To fix this, I used 7-Zip on my Windows machine and I extracted the OVA contents to my local directory and ran the deployment steps again. Or I could have just downloaded the files individually from the VMware site.
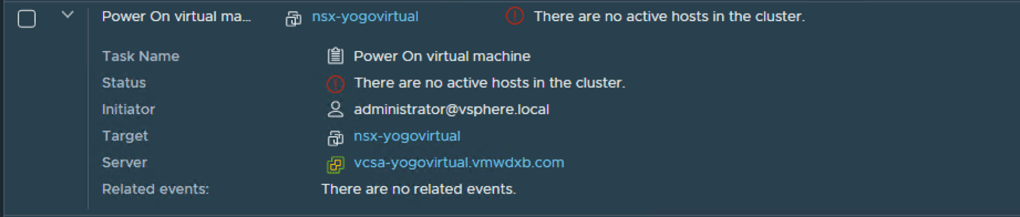
Another point to highlight – Since we are deploying a Single NSX-T Manager and will be using vSphere HA to protect the VM appliance, I found that the VM would no power up with my initial test topology where I only had one ESXi host in my vCenter Cluster.
There are no active hosts in the cluster.
To get around this, I added 2 more ESXi Servers to the vCenter cluster and then setup a 3 node vSAN cluster with DRS and vSphere HA enabled and migrated the VM files from the initial local datastore to the vSAN datastore and powered up the VM successfully.
VM Powered Up on 3 Node ESXi Cluster
I need to find out if this is the expected behaviour or if I had done something incorrectly in my vSphere deployment.
Hopefully you found this helpful. It definitely helped me to understand the deployment and configurations and consumption of this feature.
This blog post will be focusing on VMware NSX Network Security features using VLAN backed networks and hopefully help demystify the topic. It covers the deployment and ends with some demonstrations.
Overview
In the most recent NSX-T 3.2 release, VMware introduced Switch agnostic distributed security – Ability to extend micro-segmentation to workloads deployed on vSphere networks. Simple statement, but what does this really mean to the vSphere/NSX admin? Before we can answer that, it might help to look back at the history of NSX from a virtual switch view.
In NSX for vSphere (AKA NSX-V) we used the virtual distributed switch (vDS) which was present in the vCenter and the admin would enable distributed Firewall policies to VLAN or Overlay backed workloads. The admin did not need to create any additional port group/logical switch/segment as NSX for vSphere used the port groups already in place.
When NSX-T 2.X was released, we were introduced to the N-VDS. This N-VDS virtual switch was configured & managed by the NSX-T Manager and required the host to have dedicated physical nic cards connected to this N-VDS. You then created logical switches in the NSX-T manager which would represent port groups in vCenter where workloads got connected too. NSX-T Distributed Firewall would only work for workloads connected to these logical switches (NSX-T 2.X terminology) created by NSX-T manager (VLAN Backed or Overlay are both supported). vSphere admin can not edit or change any settings on these logical switches.
With NSX-T 3.0 support for the newly introduced VDS 7.0 in vSphere was introduced. This meant you could now use the VDS 7.0 created in vCenter for NSX Network & Security without the need to deploy the additional N-VDS. But… NSX Distributed Firewall and the newly introduced NSX distributed IDS would only work when your workloads are attached NSX-T created Segments (NSX-T 3.X terminology). What this meant is that you would need to go to the NSX-T Manager and create new VLAN backed networks/segments and then migrate VM’s vnic from their existing VDS created port group to the newly created NSX-T segment.
NSX-T 3.2 takes care of all of this and much more as we can do all these NSX Network Security features without the need to create an N-VDS or new segments and no no need to migrate workloads between port groups. We just do the NSX-T host preparation and we are ready for action. This is supported from vSphere 6.7 & VDS 6.6 and later.
Introduction
You can install Distributed Security only for a vSphere Distributed Switch (VDS). In other words, you can have Distributed Security on a VDS without the need to deploy a NSX Virtual Distributed Switch (N-VDS).
The following Distributed NSX Security capabilities are supported when using only the VDS:
When you install Distributed Security, configuration changes occur only in NSX-T and there are no changes in vCenter Server. The details of the VDS are discovered and the following objects are automatically created in NSX-T to represent the VDS details:
A transport node profile for each cluster.
A host switch for each VDS.
A VLAN transport zone for each VDS.
These objects are system-generated and are not configurable or editable.
Also, as part of the VDS discovery, the Distributed Virtual port groups (DVPG) and DVports of the VDS are created as objects in NSX-T. See the output at the end of the blog.
Prerequisites
The following are the requirements for installing Distributed Security for VDS:
vSphere 6.7 or later.
The vSphere cluster should have at least one VDS with distributed switch version 6.6 or later configured.
The vSphere cluster should not have N-VDS deployed.
A compute manager must be registered in NSX-T
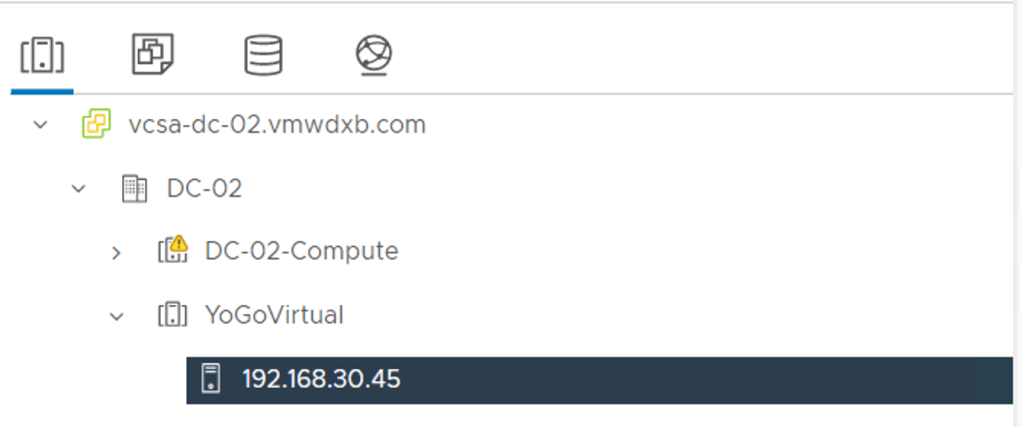
Some Pre Work done – I created a new a cluster in my vCenter – YoGoVirtual and I have a single ESXi host in the cluster (esxi-dc02-05 / 192.168.30.45)
vCenter Cluster
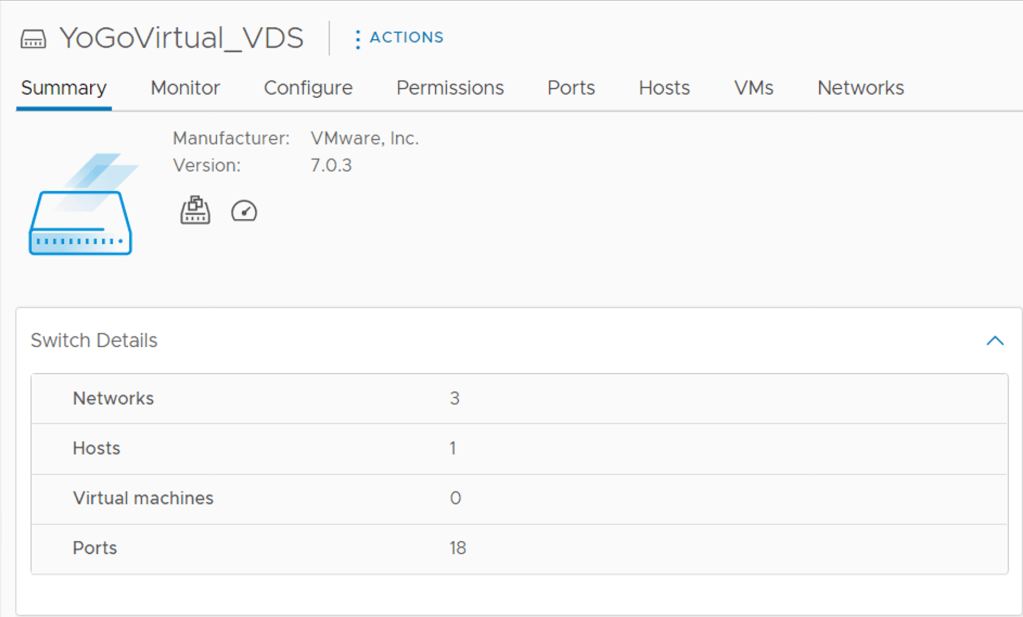
I then created a new VDS (YoGoVirtual_VDS) which I have my ESXi host connected too
YoGoVirtual VDS
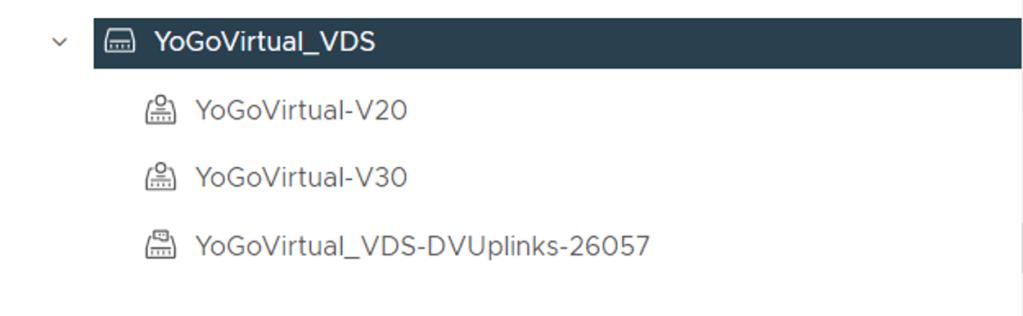
I went ahead and created to VLAN backed port groups with VLAN’s 20 and 30
Procedure
Step 1 – Open the NSX-T Manager UI
Step 2 – We are going to use the Quick Start Prepare Clusters for Networking and Security functionality
NSX-T Manager -> System -> Quick Start
Prepare Clusters for Networking and Security
Step 3 – Click GET STARTED
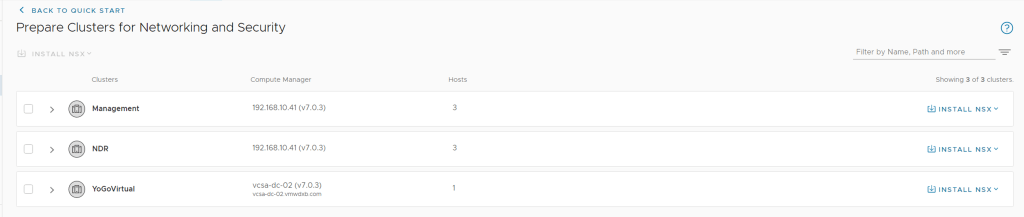
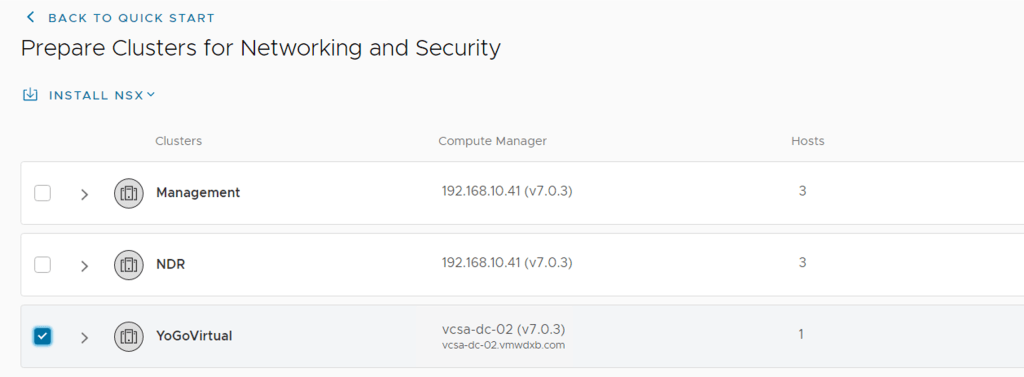
Cluster List
Step 4 – Select the vCenter Cluster you want to install NSX Security
In my case, I want to install NSX Security in the YoGoVirtual Cluster, so select the cluster on the left hand side box.
Step 5 – Click Install NSX on the far right hand side for the selected cluster.
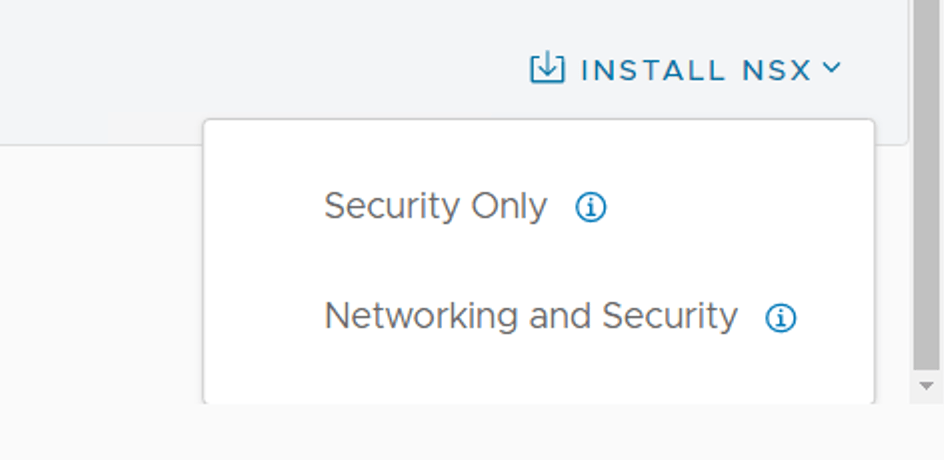
At this point you are presented with Security Only or Networking and Security
Security Only will only prepare the cluster for distributed security using VLAN backed networks
Networking and Security will add Overlay networking capabilities on top of the security features
Step 6 – Since this post is focused on Security, I selected the Security Only option and clicked Install
Step 7 – Monitoring the deployment
You can monitor the deployment progress from the Quick Start Wizard dashboard or from the Fabric view in the NSX-T Manager
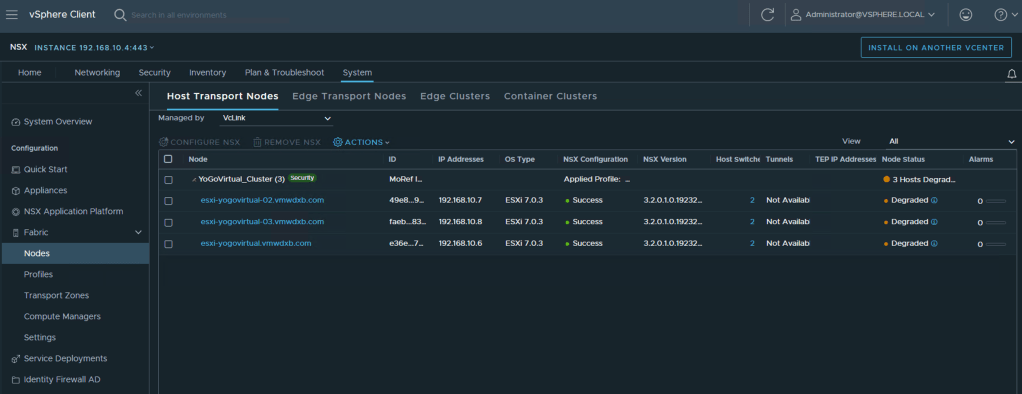
Transport Node profile gets created
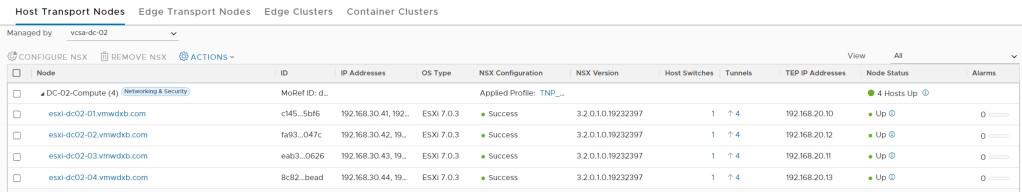
From the NSX Manager -> System -> Fabric ->Nodes -> Compute Manager -> Host Transport Nodes
Once the installation has completed, you should see the success status green
Step 8 – Review vCenter discovered Port Groups
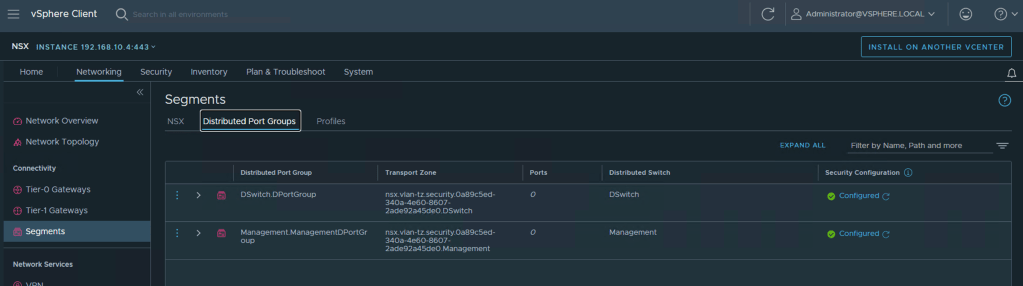
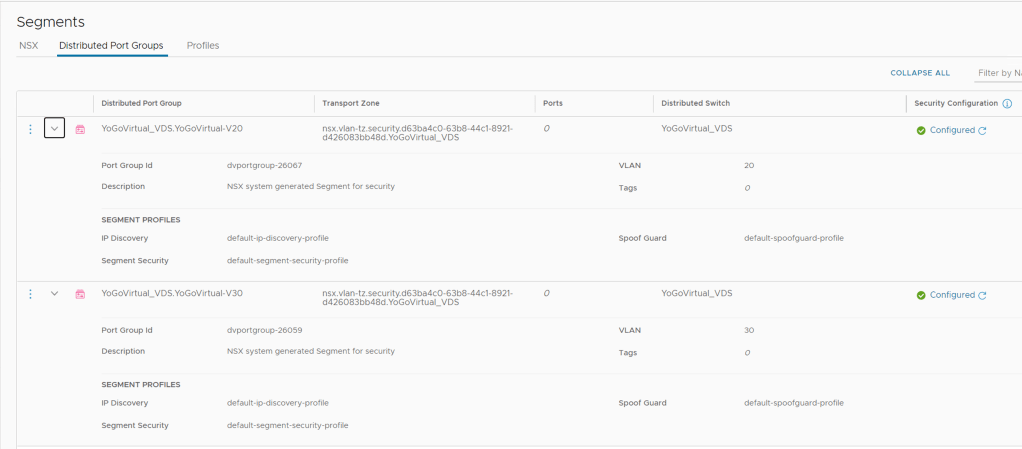
Part of the installation process is to discover and import the port groups which where already configured on the VDS. In my case I had those two portgroups for VLAN 20 and VLAN 30. Lets see where these went too in the NSX-T UI
NSX-T Manager -> Networking -> Segments -> Distributed Port Groups
Distributed Port Groups in NSX-T Manager
Here we can see the two port groups discovered all relevant VLAN ID’s and I can see that these are configured and ready for NSX Security.
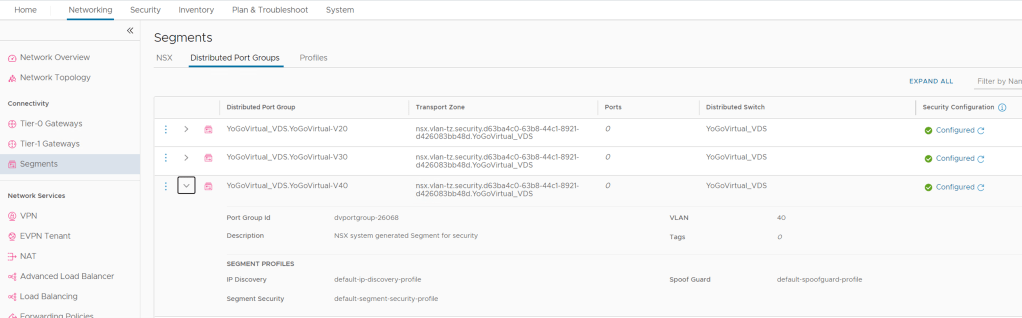
Step 9 – Create a new Port Group from vCenter
I created a new Port Group in vCenter YoGoVirtual-V40
Newly created YoGoVirtual-V40
Then went back to the NSX-T UI, refreshed the page and this newly created network showed up with all the correct settings and security installed.
Demonstration
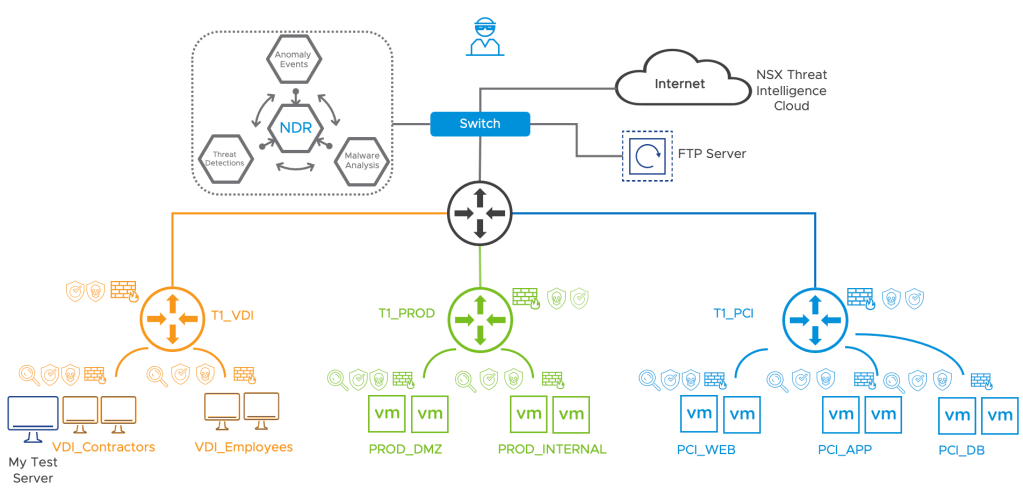
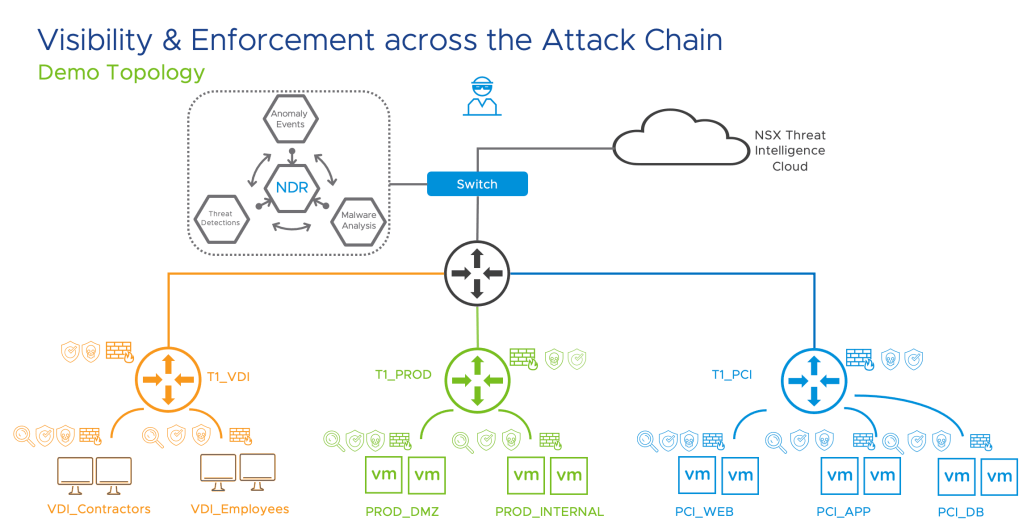
I put a quick topology together to demonstrate some of the distributed security features using the vDS port groups which we created by vCenter. My Yo Go Virtual Server is connected to VLAN30 with the default gateway outside of NSX and terminated on L3 Switch.
Test Topology
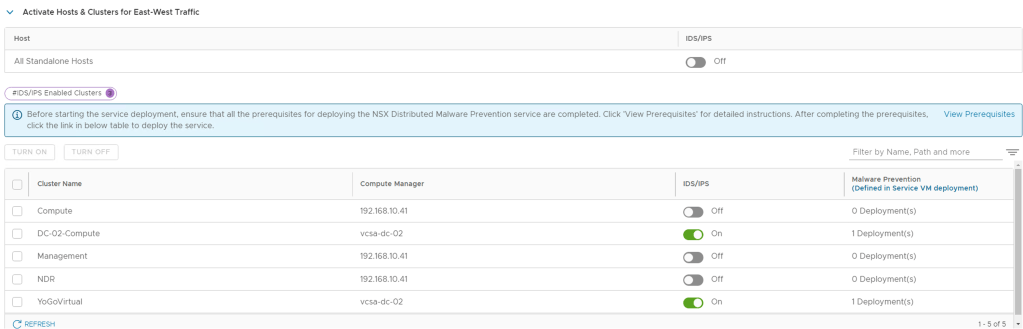
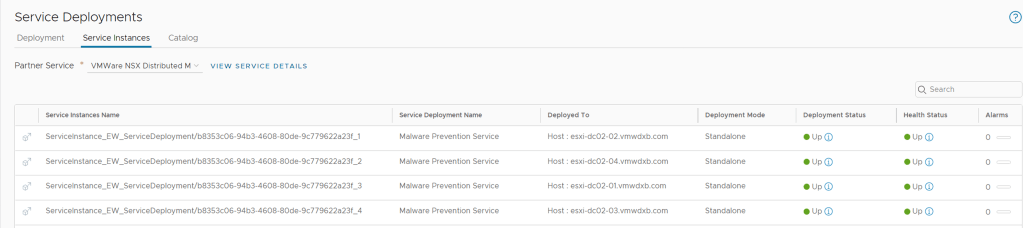
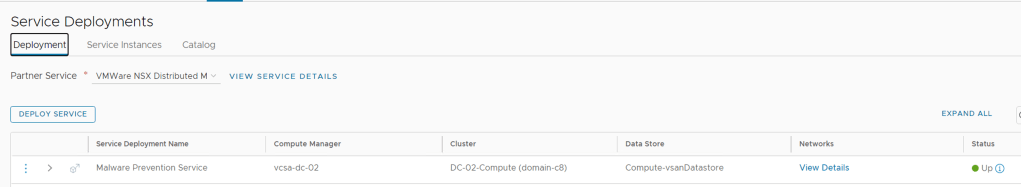
From the NSX-T UI, I enabled NSX IDS/IPS and NSX Malware Prevention for this newly prepared Cluster
Activate Hosts & Clusters for East-West TrafficMalware Prevention Service VM Deployed to new Cluster
Remember to make sure you have the full package installation of VM Tools if you are creating new test workloads for this cluster and you planning to use the Malware Prevention capability.
VM Tools Installation
Distributed Firewall Test
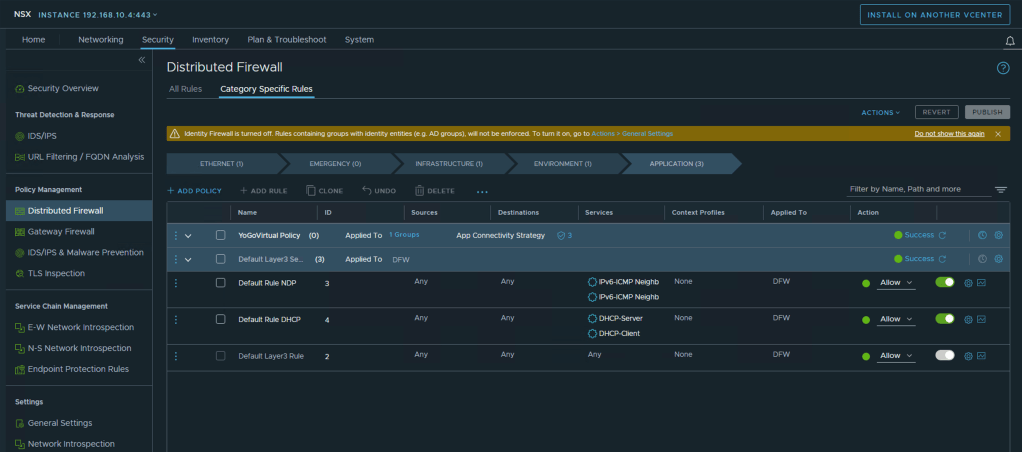
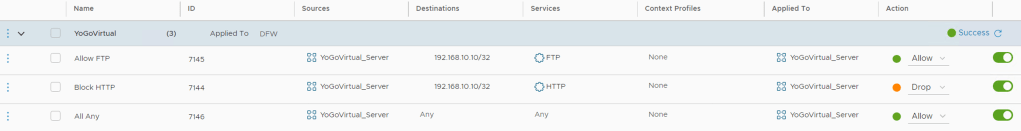
In this I will apply a simple policy to my YoGoVirtual Server that allows on FTP access to my FTP Server, the server has an IIS Web Service running too and I will block this access for the demo.
Distributed Firewall Policy
FTP Test
Succesful FTP
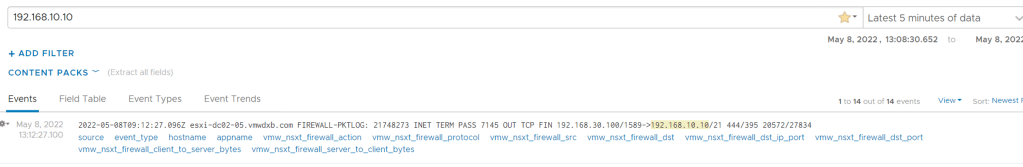
From LogInsight, I see that the FTP connection is allowed from YoGoVirtual to the FTP server and it matched rule ID 7145.
HTTP Access Test
From my YoGoVirtual Server, I am using the chrome browser and trying to access the web server hosted on my FTP/HTTP server
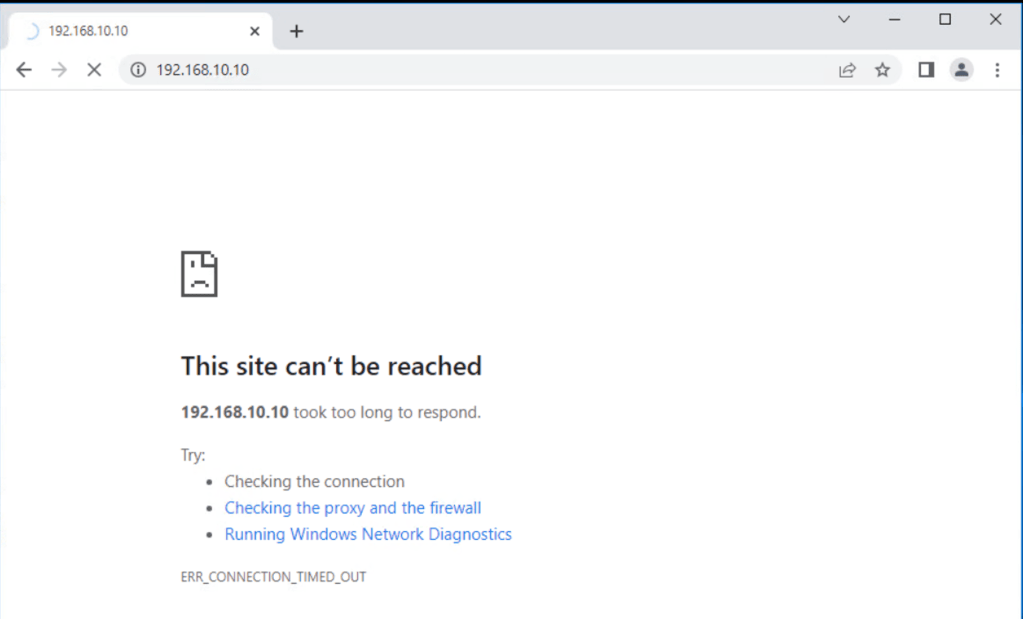
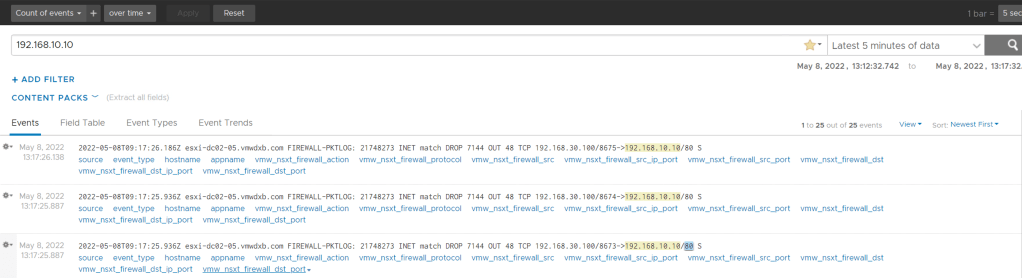
Connection Time Out
From LogInsight we can my YoGoVirtual trying to access the HTTP server and the connection is matching rule 7144 and this connection is being dropped.
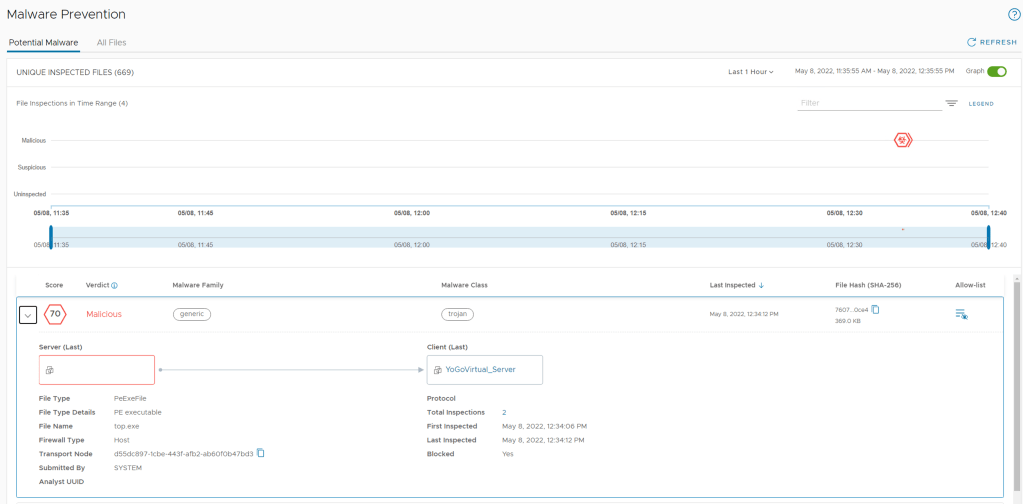
Distributed Malware Prevention Test
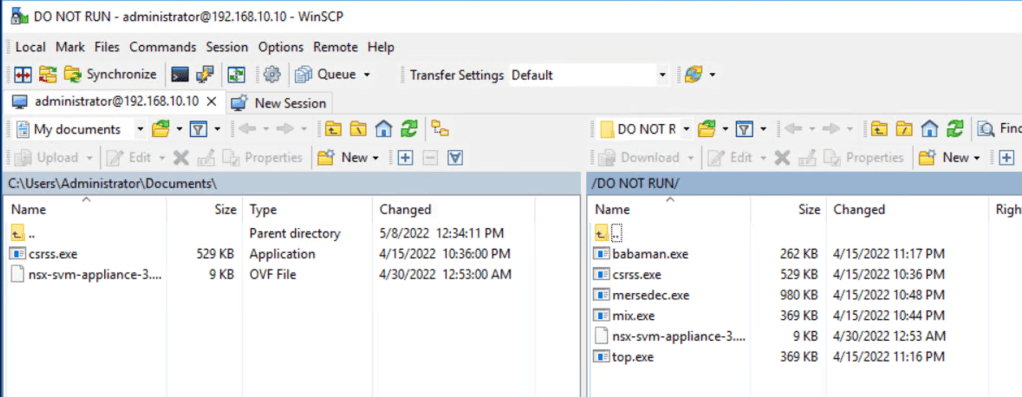
I performed an FTP from my YoGoVirtual Server to my FTP server where I previously downloaded some malware files and copied across all six files shown below on the right hand window.
FTP Session
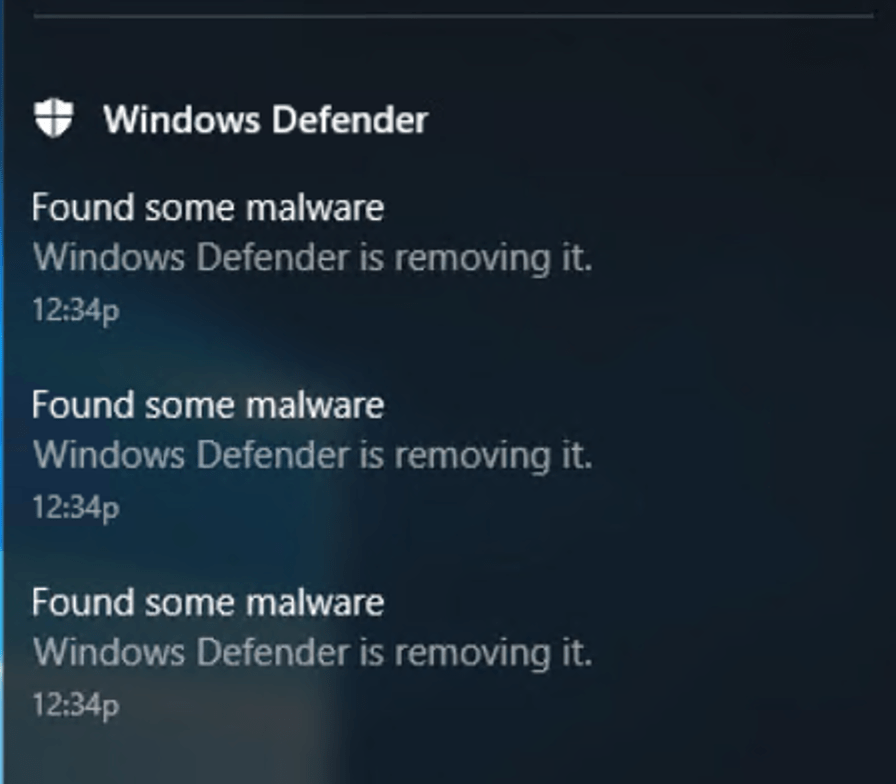
Interesting to see Windows 2016 Defender Server detected some of the files as Malware and removed them after the download took place. Except for file which was positively detected as Malware by NSX.
Windows Defender on Server 2016
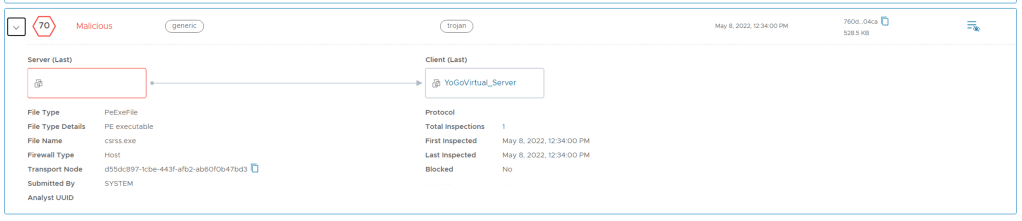
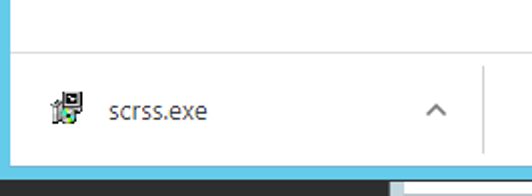
Below we can see that file named csrss.exe is identified as Malware by NSX.
NSX Detected Malware
Distributed IDS/IPS
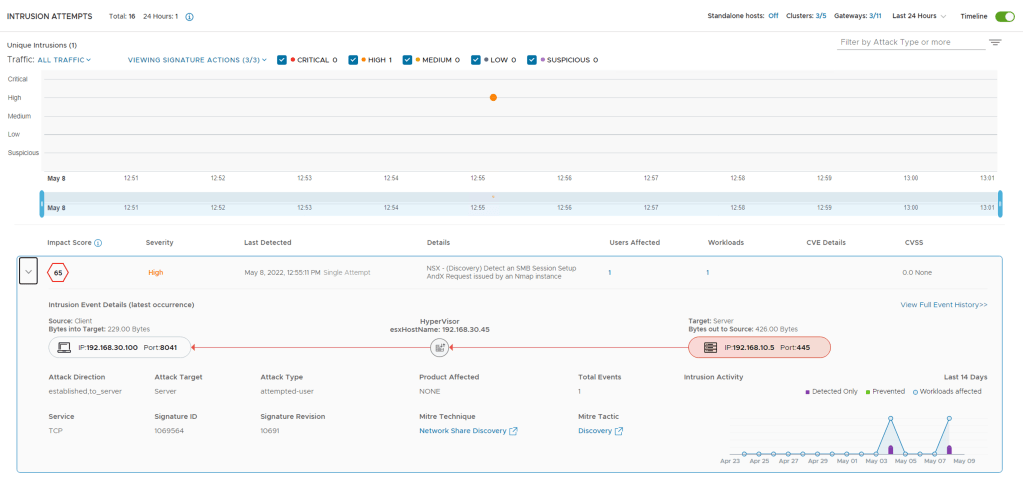
I am going to use the NMAP tool running on my YoGoVirtual machine and just do a port scan on 192.168.10.0/24 in my lab and this should trigger one of the IDS/IPS signatures.
NMAP Discovery of 192.168.10.0/24
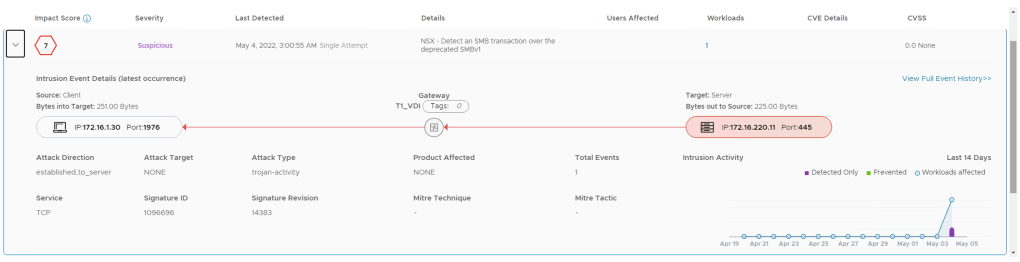
After running the scan, it triggers signature ID 1069564 which detects my YoGoVirtual server connecting to my DNS server (192.168.10.5) on SMB TCP port 445.
NSX IDS/IPS Signature Trigger
Signature ID 1069564 – NSX – (Discovery) Detect an SMB Session Setup AndX Request issued by an Nmap instance
NSX – (Discovery) Detect an SMB Session Setup AndX Request issued by an Nmap instance
Conclusion
Once Distributed Security is installed you can easily begin using NSX Security capabilities. I demonstrated how to prepare the cluster for NSX Security only – without any downtime or maintenance mode requirements and then how three major NSX Advanced Threat Prevention use cases worked on native VDS port groups without any network changes or virtualization settings.
An observation, I noticed that my port groups only appeared under the distributed port groups menu in the NSX UI after the vSphere Cluster was prepared following the steps above.
For cluster(s) which already had NSX installed using the vDS, the port groups created in vCenter were NOT imported to NSX-T. So I am going to assume at this stage that we can only use the Switch Agnostic feature for new vSphere Clusters which have not been prepared by the NSX-T manager before. You could still do all these Security features with VLAN backed networks but they would need to be created as segments.
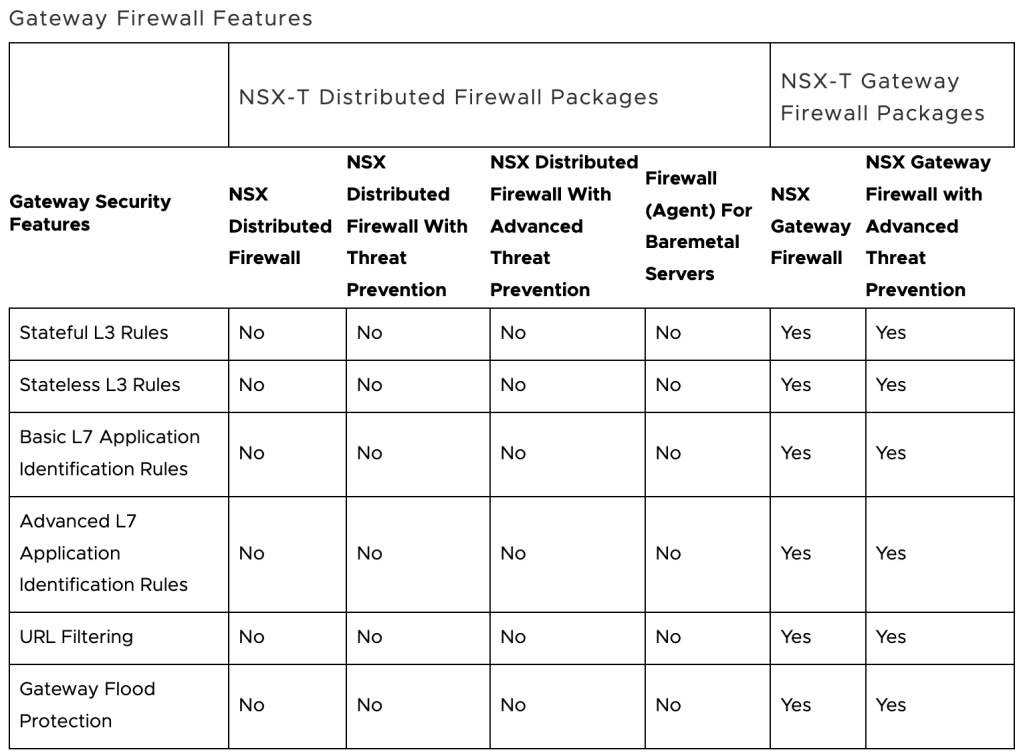
NSX-T 3.2 introduces a new Security feature on the Gateway Firewall, URL Filtering.
URL filtering can prevent malicious code, spyware, phishing attempts and other threats by blocking access to websites or URLs that may cause a security risk. URL filtering enables access-control based on URL categories, URL reputation, and custom URLs.
URL filtering is supported only on a Tier-1 gateway. URL filtering access control policy is enforced for both encrypted (https) and non-encrypted (http) traffic. With encrypted traffic, users must enable TLS Inspection policy to decrypt the traffic to get full URL filtering. Without TLS inspection, a URL filtering policy will enforce policy at the domain level using TLS Server Name Indication (SNI) extension in the TLS client hello.
This feature works hand in hand with FQDN Analysis (called URL Analysis in NSX-T 3.0) – covered in my blog post here.
Creating a URL Filtering Policy
URL filtering is configured using an L7 access profile in Gateway firewall rules.
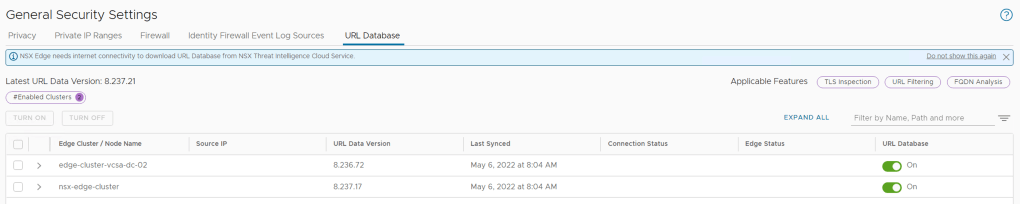
Step 1 – Enable the URL Database on the Edge Cluster(s) where you want to enable this capability. This will trigger downloading latest URL database from the NSX Threat Intelligence Cloud Service.
From the NSX Manager -> Security -> General Settings-> URL Database
NOTE: NSX Edge Management Interface needs internet connectivity to download URL Database from NSX Threat Intelligence Cloud Service.
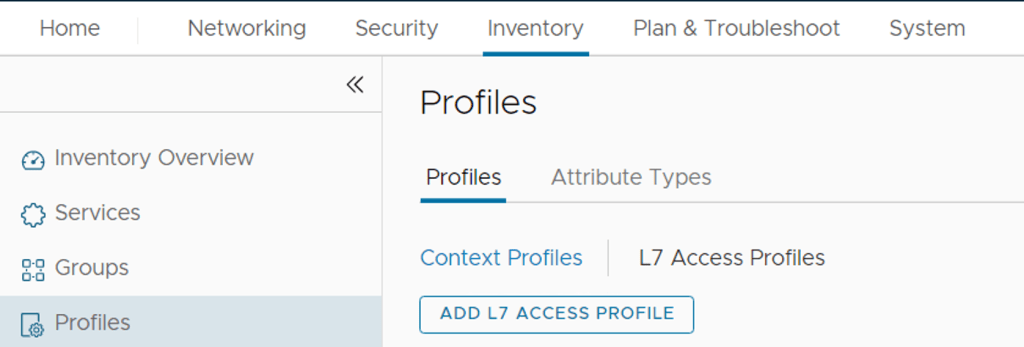
Step 2 – Create an L7 access profile for URL filtering.
The Profile will define how you want to handle accessing URL’s based on URL Category, Custom URL’s or URL Reputation.
From the NSX Manager -> Inventory-> Profiles -> L7 Access Profiles
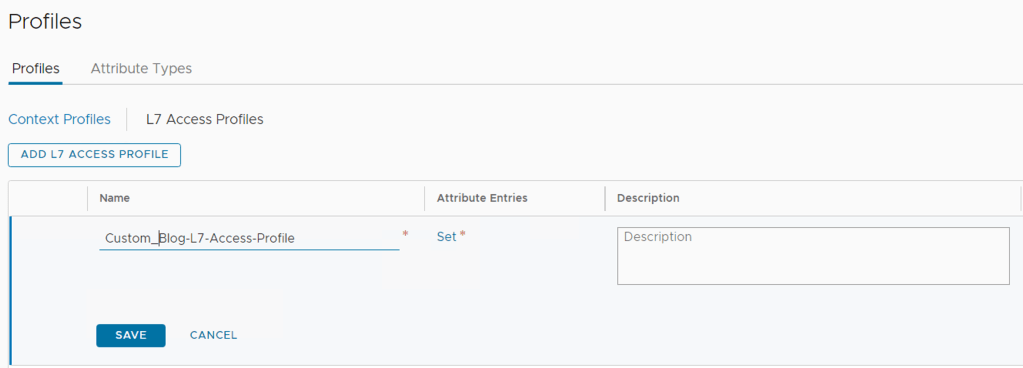
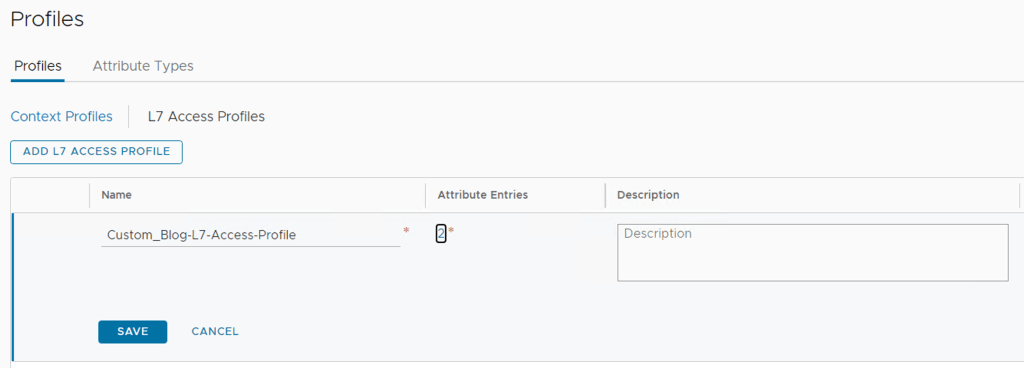
Click ADD L7 ACCESS PROFILE if you want to create a custom profile and start by entering a name for the custom policy and the Click Set
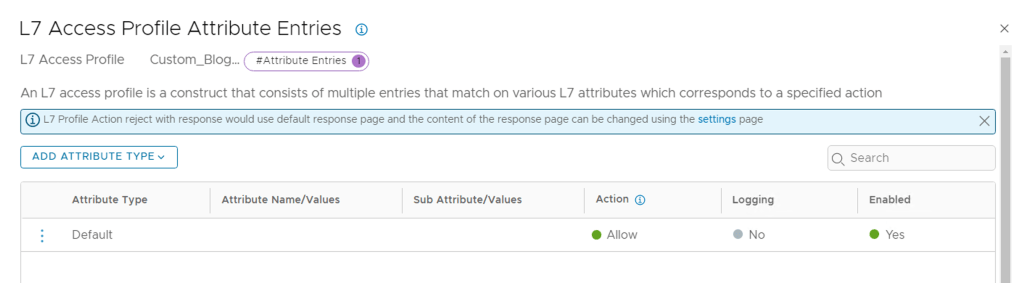
Now we can add attributes by Click ADD ATTRIBUTE TYPE. You can create Multiples of these with various actions.
Here are some guidelines on how to best use the attributes. Further details here.
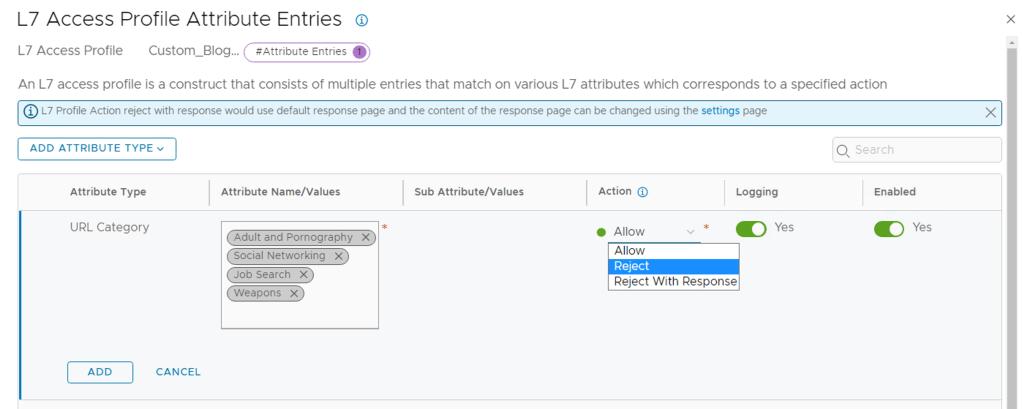
I am going to create a Profile matching URL Category and then add some Attributes and then set the Action.
L7 Access Profile Attribute Entries
If you click in the Attribute Name/Values block it will list all the default values, let’s select some Categories we want to prevent access too.
L7 Access Profile Attribute Options
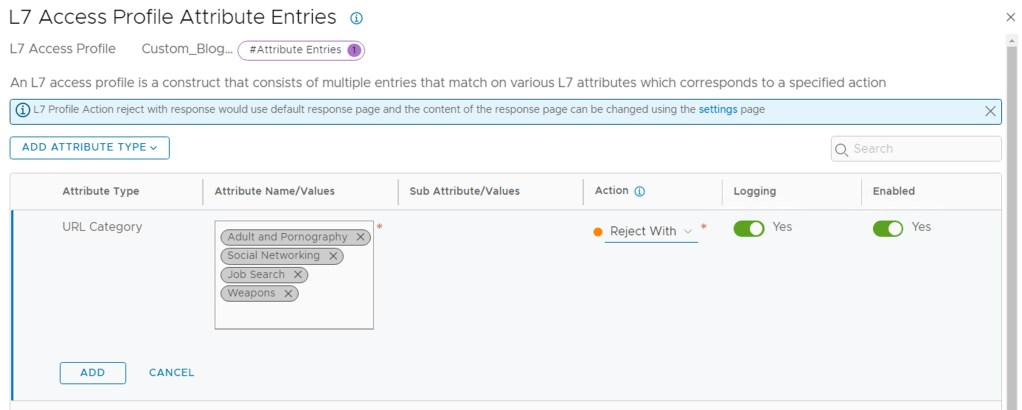
I selected 4 Categories I want to block access too, if you select the Action you see three options (Allow, Reject, Reject with Response). Allow will allow access, Reject will just block access to a website that matches the category and Reject with Response will redirect the user to a splash page – covered in the next few steps. I am going to select Reject with Response to show what happens here.
URL Categories
I enabled logging and Clicked ADD.
Note: The logs for these Gateway rules are generated on the NSX Edge appliance associated to the T1 where you are apply the policies. So you need to make sure that you have enabled logging locally on the Edge appliance or using the Node Profile settings under System Fabric -> Profile -> Node Profiles -> All NSX nodes. I added the LogInsight IP and Port/Protocol details using 514/UDP. When I tried using the protocol as LI, I did not receive any logs in LogInsight.
Then click Apply at the bottom right
Lastly Click Save and this saves the new L7 Profile
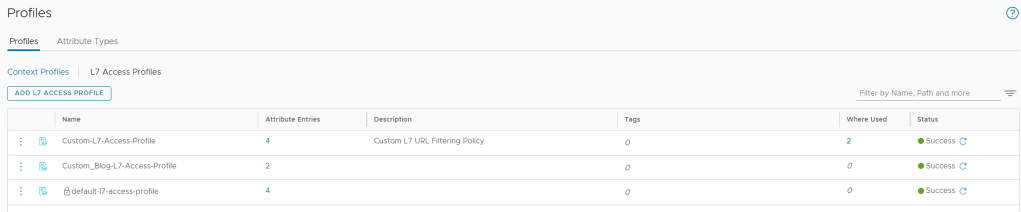
Once saved, it should show the status as Success & Green
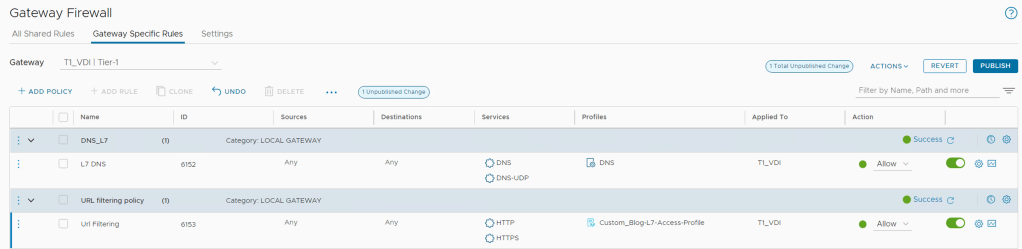
Step 3 – Create URL filtering policy. Create a gateway firewall rule using the URL filtering profile created in step 2. The filtering policy can only be Applied To Tier-1 gateways. The rule action with an L7 access profile must be Allow.
From the NSX Manager -> Security -> Gateway Firewall -> Gateway Specific Rules -> Select the T1 Gateway where you want to enabled the feature
Create a Policy -> ADD Policy, the ADD a rule under this policy – enter the names as needed.
Applied To = The T1 where we are enabling this (Auto populate)
Action = Allow (This must set to allow, the action will be controlled by L7 Profile)
URL Filtering L7 Access Policy applied to T1_VDI
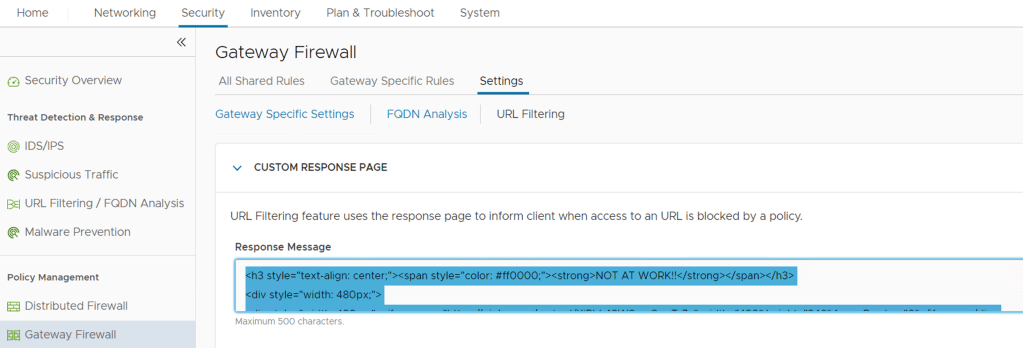
Step 4 (Optional) – Create a custom response or accept the default for when the L7 access profile Action is specified as Reject With Response.
From the NSX Manager -> Security -> Gateway Firewall -> Settings -> URL Filtering
You can edit the default Response Page text in the box provided or you can do some custom code – not sure if the custom code is officially supported. I used some code which I received from one of my fellow bloggers – https://cloudblog.tech/security/nsx-t-url-filtering-custom-response/
Custom Response Page
Once you have completed the customisation, click SAVE
Testing URL Analysis
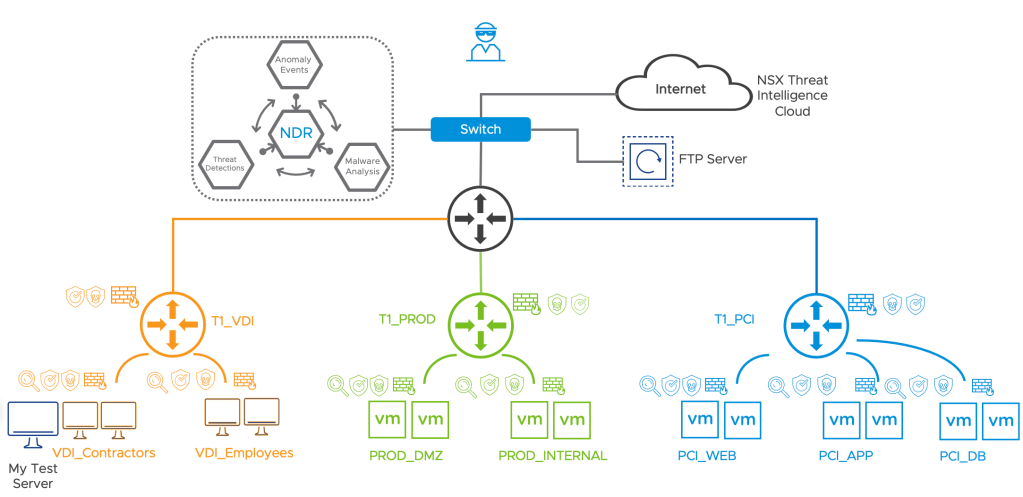
I am using the test topology below and will be using Chrome on the My Test Server machine. The URL inspection is applied to the uplink interface on the T1_VDI.
We can monitor the URL Analysis activity from the NSX UI too
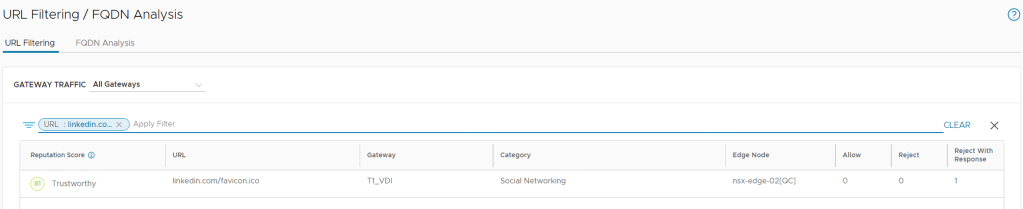
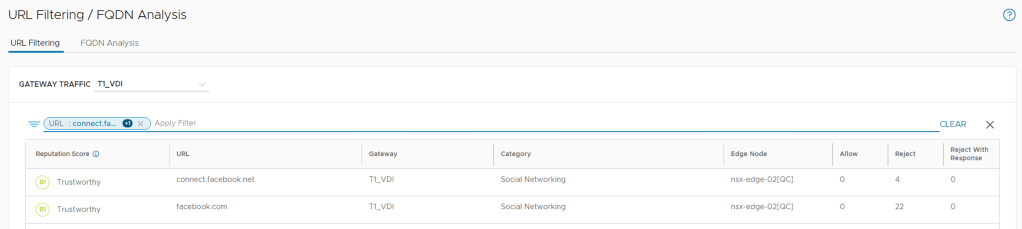
From the NSX Manager -> Security -> URL Filtering / FQDN Analysis -> URL Filtering-> Select the T1 under Gateway Traffic
It shows the following details:
Reputation Score
URL
Gateway
Category
Edge Node
Allow Action
Reject Action
Reject with Response
NSX Security – URL Analysis Dashboard
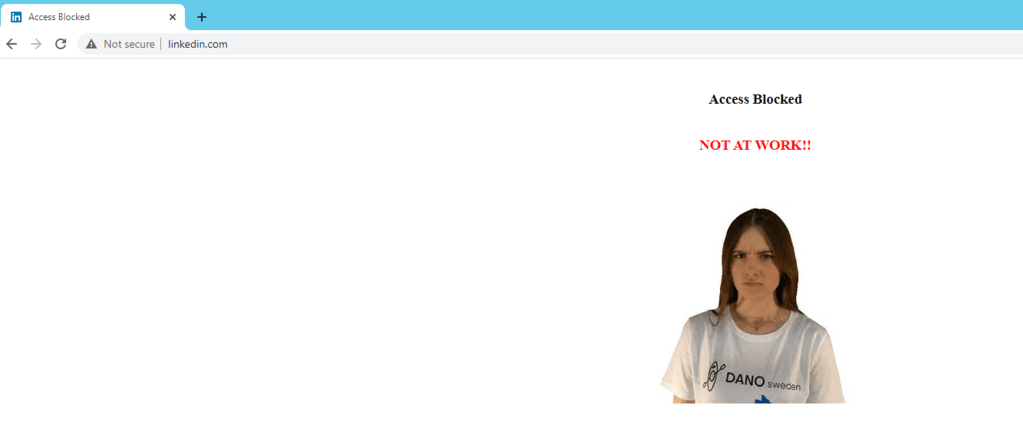
Test 1 – Accessing LinkedIn from my Test Server
URL Analysis – Reject with Response
From NSX UI the dashboard, I filtered to the URL LinkedIn and see that it was matched and marked with the correct Reject with Response page – as shown above too.
URL Analysis Dashboard
Test 2 – Accessing Google from my Test Server
Accessing to Google works fine and I can confirm this from the logs in Log Insight too
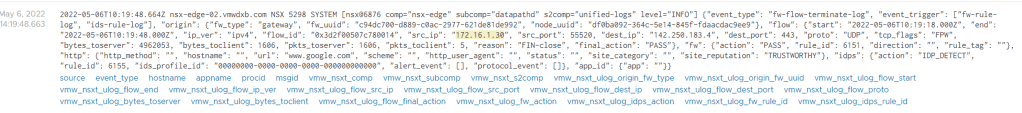
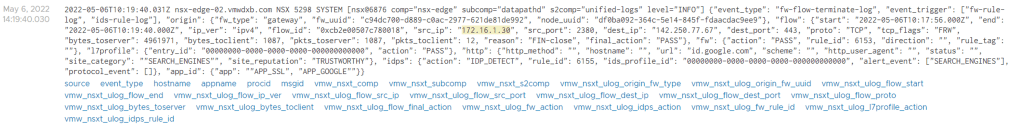
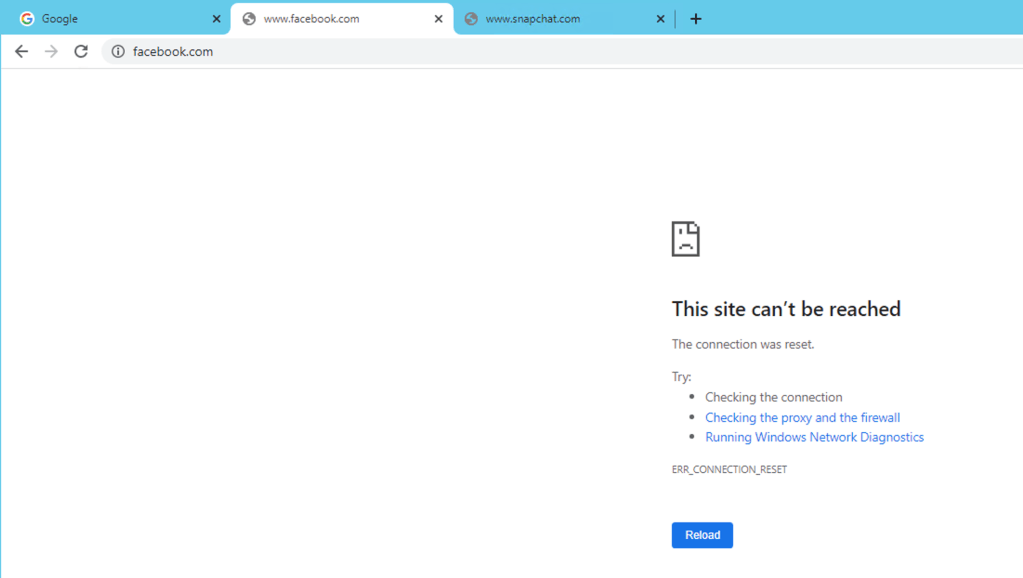
Test 3 – Accessing Social Network – Facebook
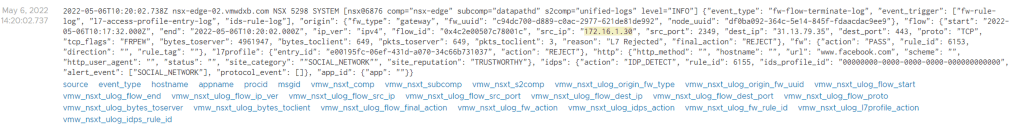
Accessing Facebook got blocked as expected but the action was just rejecting the access instead of reject and respond.
So I checked the logs in Log Insight to see why this would be happening, I see the connection matching the l7-access-profile and the destination IP belongs to Facebook and the URL is shown further into the logs but the action is set to “REJECT”.
LogInsight Output
From the NSX UI Dashboard, when I filtered to the URL facebook I saw the same results showing the Reject action instead of the Reject with Response.
I need figure out why Social Networking is being classified correctly but the action defaults to Reject instead of my configured behaviour option of Reject with Response.
Summary
I demonstrated the basic setup and matching URL on categories, but you have the option to add additional match criteria for URL Reputation and Custom URL’s too.
The setup and configurations are fairly straightforward, but you definitely need to make sure that your Management Interface on the NSX Edge appliance can reach the Internet and has DNS resolution working else you will not be able to download the database and will not see anything.
Lastly, this feature went General Available in NSX-T 3.2 and it is included in the NSX Gateway Firewall license package – if you do not have the NSX-T Gateway add-on license then you will not be entitled to use this capability. Refer to Product Offerings for NSX-T 3.2 Security for license requirements and entitlements.
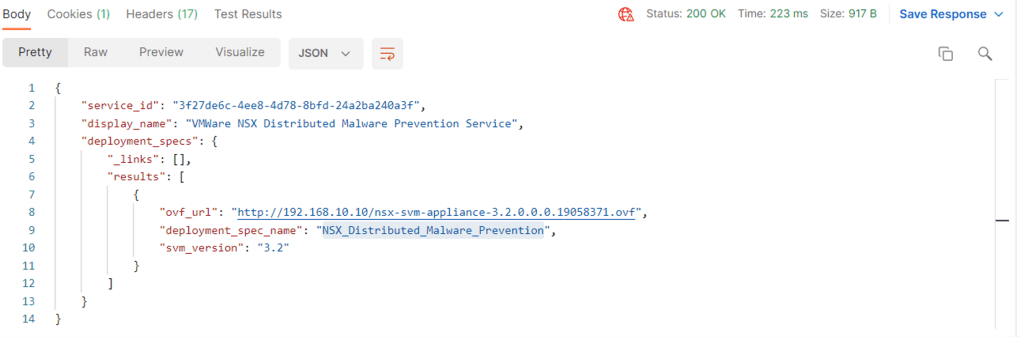
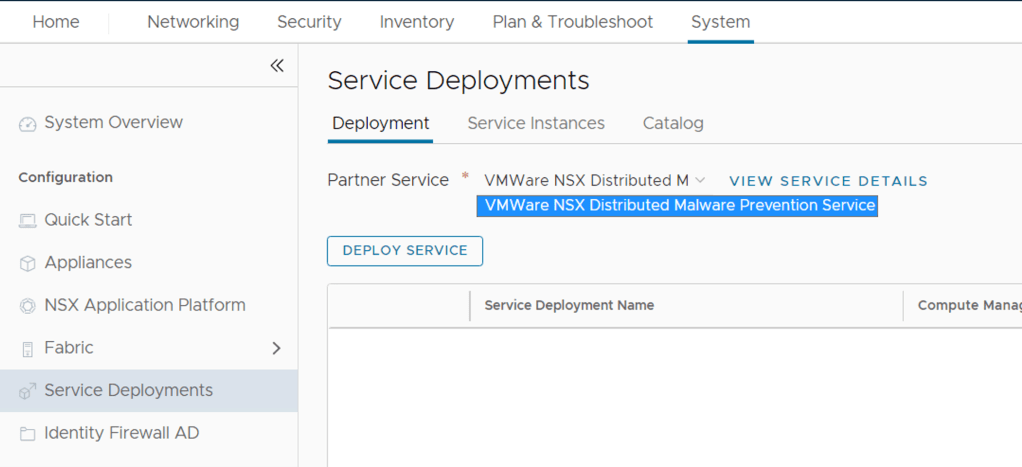
This is a follow up to my previous post where I covered NSX Malware Prevention & Detection deployment. Now I will cover what needs to be configured beyond the NAPP deployment and the SVM deployment for distributed Malware Prevention or the NSX Edge VM for Gateway Malware Detection.
Demo Topology
Overview Demo Setup
I have NSX-T 3.2.0.1 deployed with VMware ESXi, 7.0.3, 19482537 and vCenter 7.0.3. The NSX Application Platform is deployed and the SVM’s for distributed Malware Prevention are deployed too.
For the distributed Malware Prevention which uses the Guest Introspection framework, I am going to use a Windows 2012 server (shown as My Test Server in the diagram) with IP Address 172.16.1.30. This machine has the required VM Tools installed. I will use this test machine to download some malicious files from the Internet and trigger the Malware Prevention feature in NSX. We should be able to see some malicious content which is detected by the static analysis done on the SVM and will be able to see malicious content which requires dynamic analysis in the NSX Intelligence Cloud. So NSX is going to send this file to the cloud Sandbox for analysis. If you don’t to send files for dynamic analysis I will cover how to disable this option.
The Gateway Malware Prevention will be done at the T1 Uplink T1_VDI in my demo topology – Take note that this feature is only supported on the T1 uplink interface today and not supported on the T0. The Gateway Malware Detection feature leverages the NSX Gateway Intrusion Detection and Prevention (IDPS) feature for file extraction, Gateway IDS/IPS is only Tech Preview in NSX-T 3.2.0.1 and should be generally available from NSX-T 3.2.1 – so take care when enabling Gateway IDS/IPS.
I will download some Malicious content to the FTP server (192.168.10.10) which is located outside of my NSX environment to the My Test Server and trigger the Malware Detection feature on the T1 uplink.
NOTE: In NSX-T Data Center 3.2, NSX Distributed Malware Prevention service can detect and prevent malware only on Windows guest endpoints (VMs).
On the distributed east-west traffic, malware detection and prevention is supported only for Windows Portable Executable (PE) files that are extracted by the GI thin agent on the workload VMs (endpoints). Other file categories are not supported currently by NSX Distributed Malware Prevention. The supported maximum file size limit is 64 MB.
Getting Started
Summary of getting Malware Prevention working
I am going to start with the the Malware Prevention profile(s) and move through the various steps. I will split the configurations for Distributed and Gateway Malware Prevention into two parts – they could share profiles, security groups too.
Distributed Malware Detection & Prevention
You will find that Malware Prevention configurations have been placed with the NSX IDS/IPS feature configurations
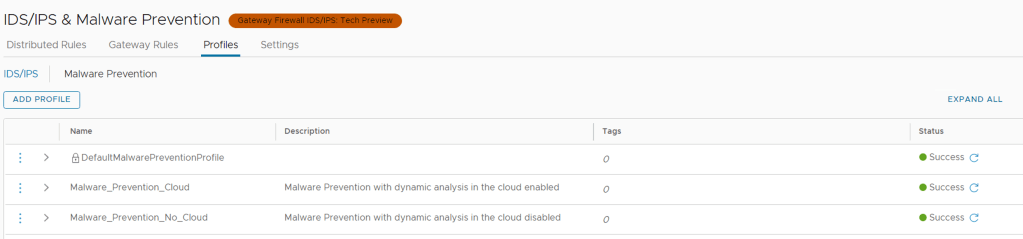
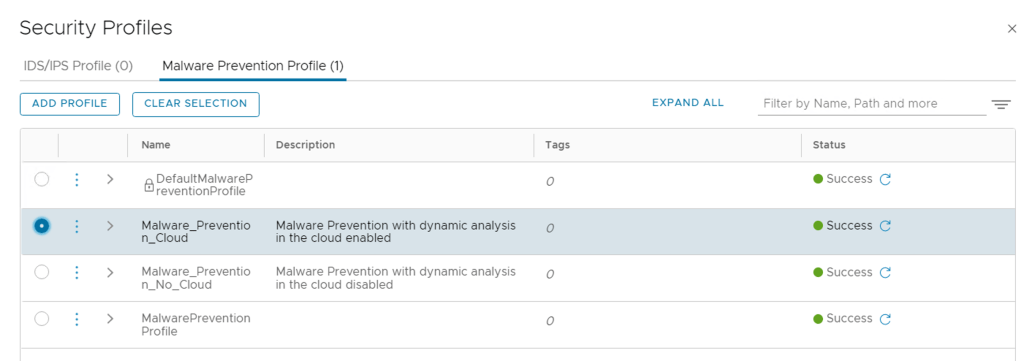
Step 1 – Create Malware Prevention Profile
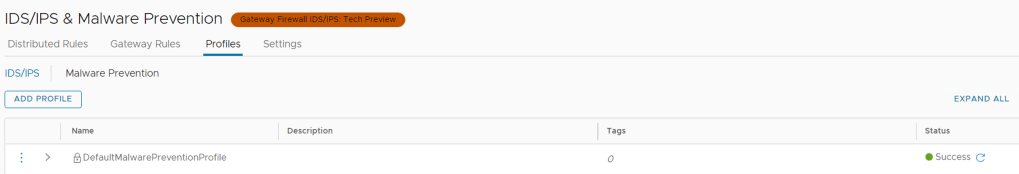
From the NSX-T Manager -> Security -> IDS/IPS & Malware Prevention -> Profiles -> Malware Prevention
Default Malware Prevention Profile
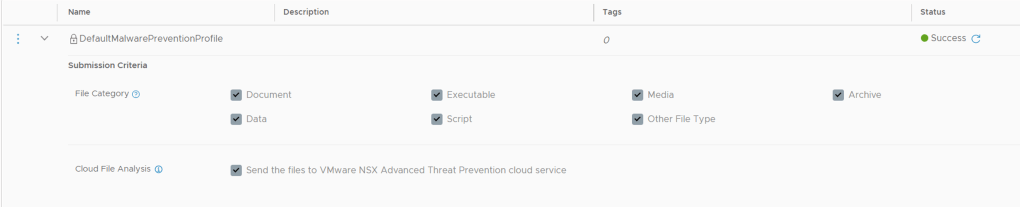
If you click on the grey right arrow (>) next to the name of the DefaultMalwarePreventionProfile it will expand the default settings of this profile. The default profile does not allow you to change anything in it.
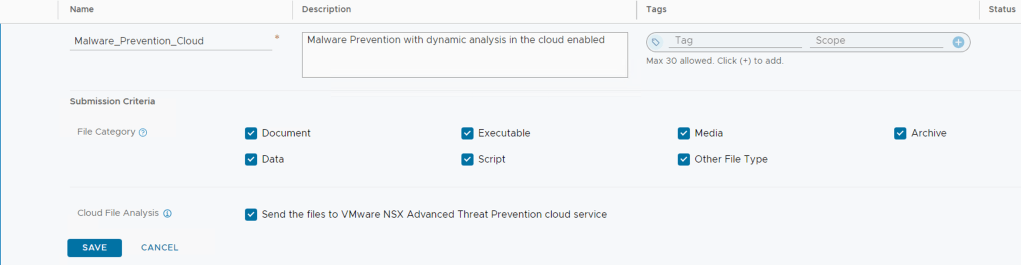
So lets create a new Profile by clicking on ADD PROFILE
Now give your profile a descriptive name, and here you can select which files types you want to have inspected when we apply this policy to our rules later.
You will also notice the last option is to select if you want files to be sent to VMware Cloud for dynamic analysis – this is the only place configurable for this option.
I have created two profiles, one that allows dynamic analysis and another profile where I have deselected this option. Even though NSX-T 3.2.0.1 only supports Executable files on the distributed deployment today, I have just left my profile with all file types selected since I am going to re-use the profiles for the Gateway Malware Policies.
Click SAVE when done.
Malware Prevention Profile with Dynamic File Analysis enabledMalware Prevention Profile With No Dynamic Cloud Analysis enabled
Once saved, the status should be green and Success
Malware Prevention Profiles Created
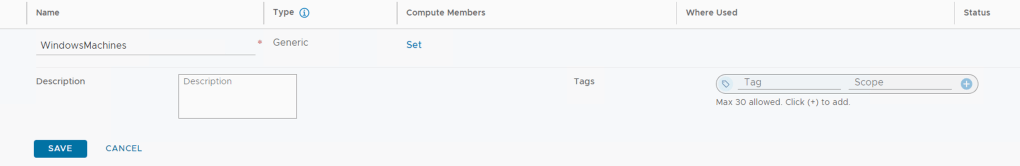
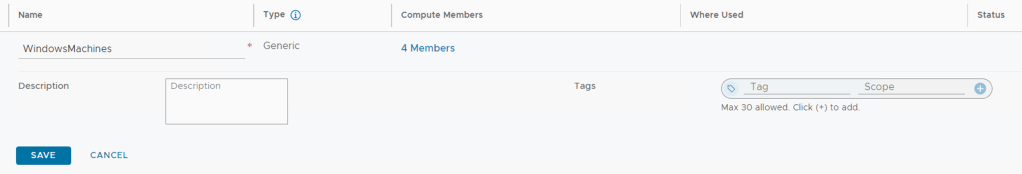
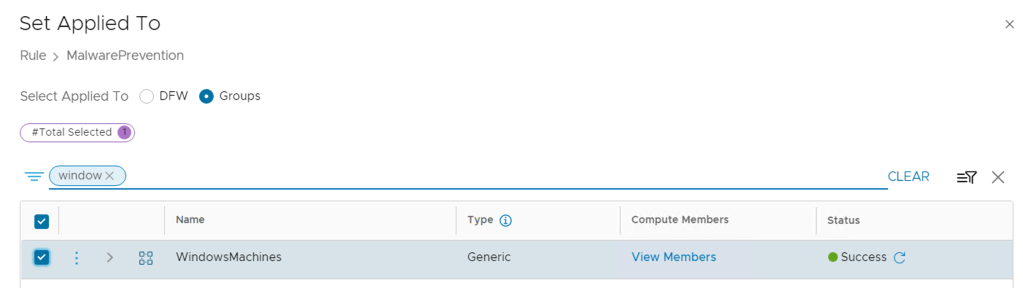
Step 2 – Create Groups and add VMs you want to protect
You can use existing groups or create new groups for this part, I created a Group which includes all my Windows machines.
From the NSX-T Manager -> Inventory -> Groups -> ADD GROUP
Windows Machines Group
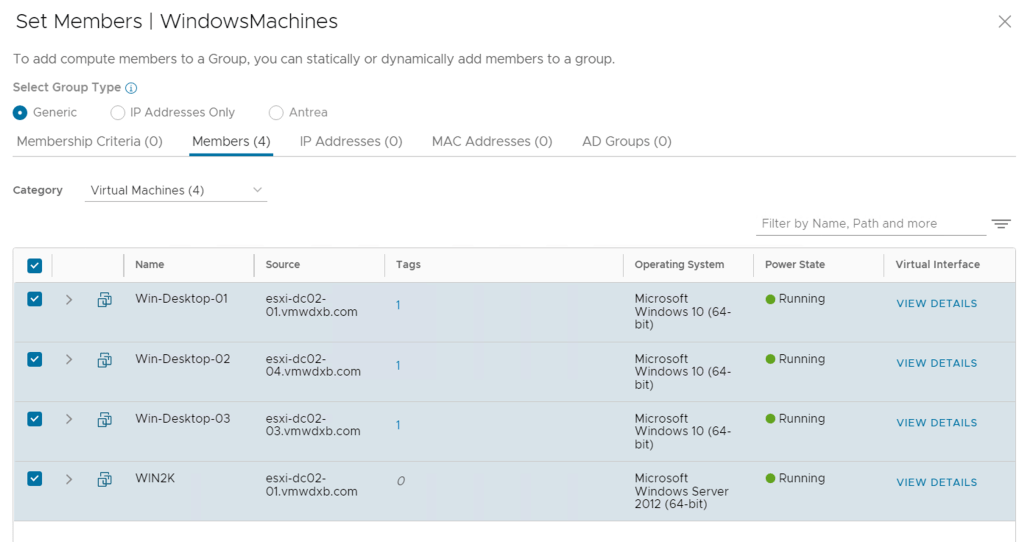
Click on Set Members -> Members -> Category -> Virtual Machines -> Select the VM’s you want to included -> Apply
I am manually selecting the VM’s I wanted in this group.
Note: Groups for Malware Prevention feature should contain members of type VirtualMachine only
Then click SAVE
Step 3 – Add Distributed Malware Prevention rules
Distributed Malware Prevention Policies are created at the same place where we create IDS/IPS rules, its the profile you apply that differentiates the rule to be IDS/IPS or Malware Prevention
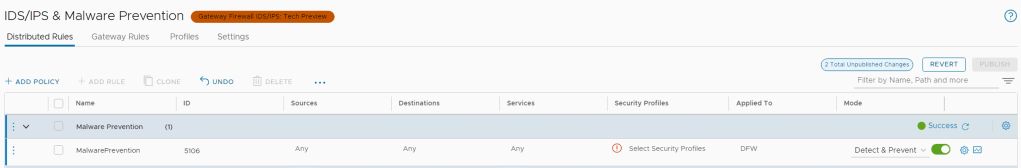
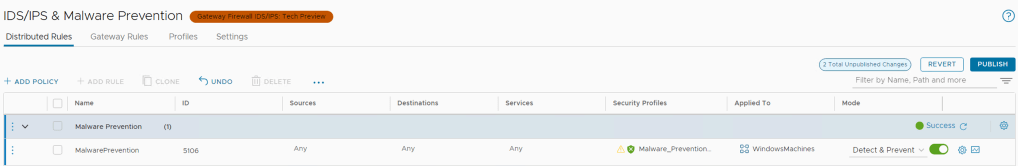
From the NSX-T Manager -> Security -> Policy Management -> IDS/IPS & Malware Prevention -> Distributed Rules -> ADD Policy
Lets start with adding a Policy Section and name it Malware Prevention and add one rule named the same – you can name yours what works for you.
Leave the Source, Destination and Services to their default values “ANY” and select the Security Profile – This will be the Malware Prevention profile created in step 1 (You can select only one profile). Be sure to select Malware Prevention Profile from the top so that it lists the profiles specifically for Malware Prevention and not the IDPS profiles. I selected my Profile that has dynamic file analysis enabled.
Click Apply once you have selected the correct Profile.
Next you need to apply this rule to the Group of VM’s which you want to enable the feature on, so select the Group which you created in Step 2. I am using my group WindowsMachines. Click Apply.
The final option is select the MODE, it can be Detect or Detect & Prevent. I am going to use Detect and Prevent.
The optional configuration bits like Logging, Direction, Log Label are not used by Malware Prevention and can be ignored.
Once the rule is created, you need to Publish the changes on the top right
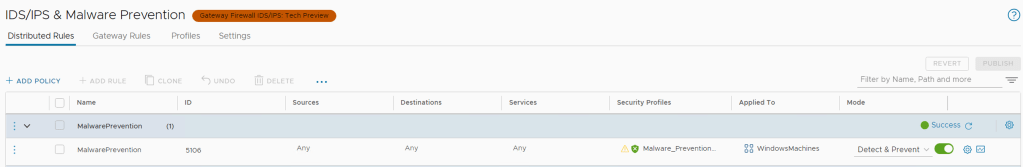
Rules before publishing
Once published, the status should show Success
Gateway Malware Prevention
For Gateway Malware Prevention the configuration steps are very similar to the distributed capability with a few additional touch points and configurations.
Step 1 – Enabled Gateway IDS/IPS and Malware Prevention
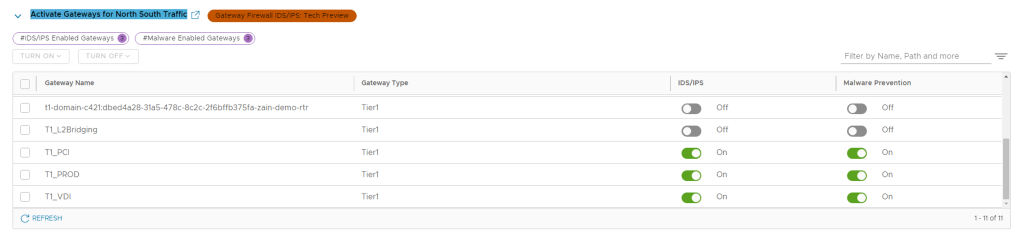
From the NSX-T Manager -> Security -> Policy Management -> Settings -> Activate Gateways for North South Traffic
Since Gateway Malware Prevention uses Gateway IDS/IPS and is implemented on the uplink of the T1 router, we need to enable these capabilities for the selected T1’s. In my case I have selectively enabled IDS/IPS and Malware Prevention. I am expecting my FTP flow to pass the T1_VDI.
Enable Gateway IDS/IPS and Malware Prevention
Step 2 – Add Gateway IDS/IPS and Malware Prevention Rules
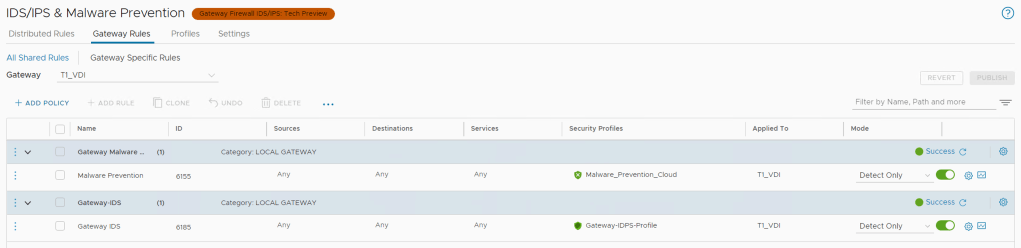
From the NSX-T Manager -> Security -> Policy Management -> IDS/IPS & Malware Prevention -> Gateway Rules
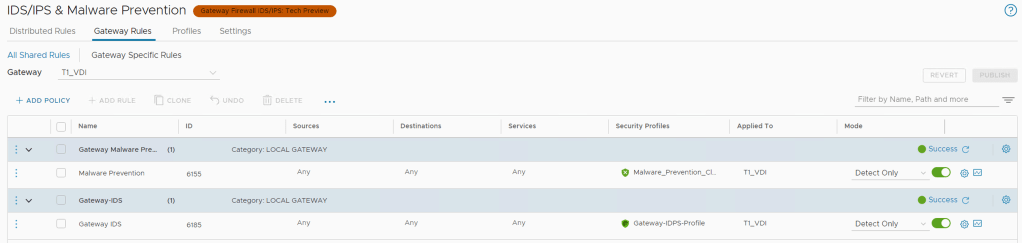
NOTE: You need a IDS/IPS Profile for this section, you can reuse the default one or create one for your needs, I created one that I named Gateway IDPS Profile and left it default with everything checked.
Select the T1 Gateway where you want to enable the features. Next to Click the drop menu that lists the T1 Gateways in your environment and select the first one you want to configure. T1_VDI in my case.
Similar workflow to the distributed Malware Prevention rules, but here we need to add one more rule that enables IDS/IPS too so I created one Policy section for Malware Prevention and re-used the same Cloud enabled Malware Profile and another Policy with a rule for IDS/IPS and selected the IDS/IPS Profile here.
Take note of the below points
On clicking the edit icon, the UI displays a list of all available services. However, NSX Malware Prevention currently supports detection of file transfer only for the following services: HTTP, HTTPS, FTP, and SMB.
NSX Malware Prevention on the Gateway Firewall currently does not support extracting and analyzing files that are uploaded using HTTP. However, if files are uploaded using FTP, the extraction and analysis of the files for detecting malicious behavior is supported.
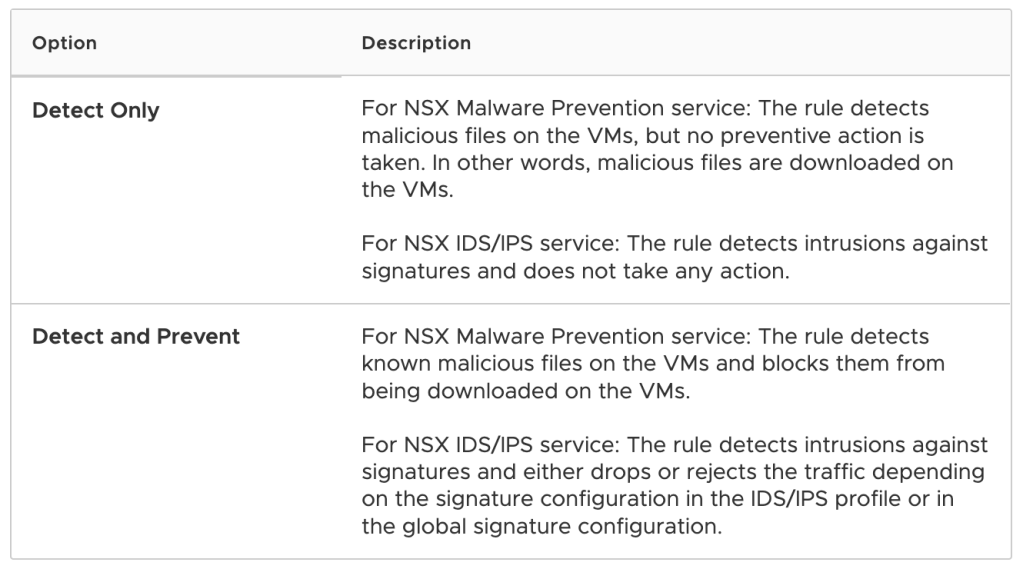
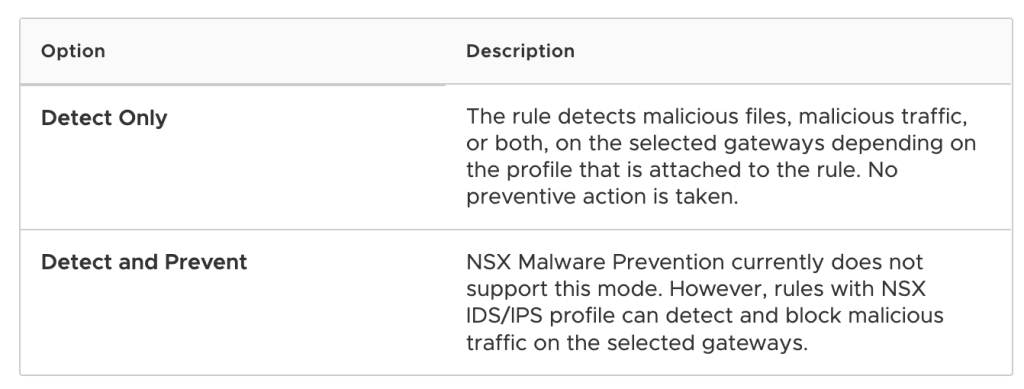
Mode, Only Detect is currently supported on the Gateway – see below.
Gateway Supported Modes
Once you have published the rules you should see the status Green and Success
Gateway rules published to T1_VDI
Demonstration of Malware Prevention
Now that all the configurations are in place, we are ready to test it. Lets check the status dashboard
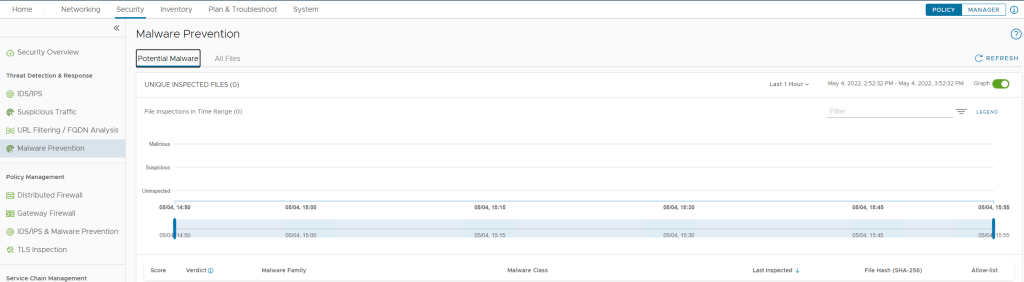
From the NSX-T Manager -> Security -> Malware Prevention
Malware Prevention Dashboard
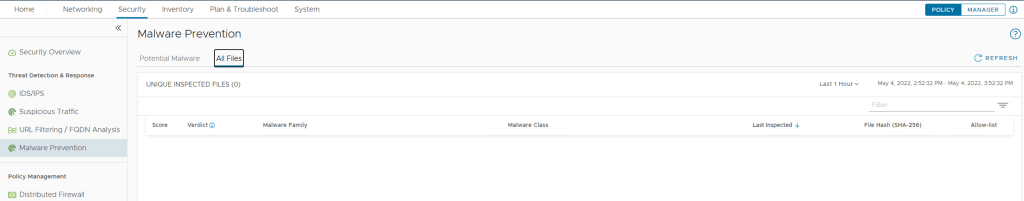
From the NSX-T Manager -> Security -> Malware Prevention -> All Files
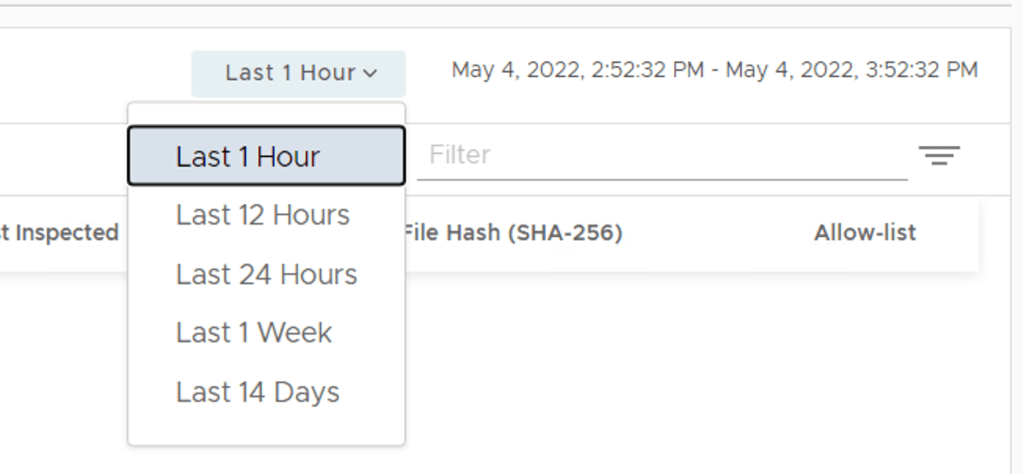
So from these two dashboard we currently don’t see any events for the last hour, you can adjust the time range at the top right from 1 Hour to 14 Days
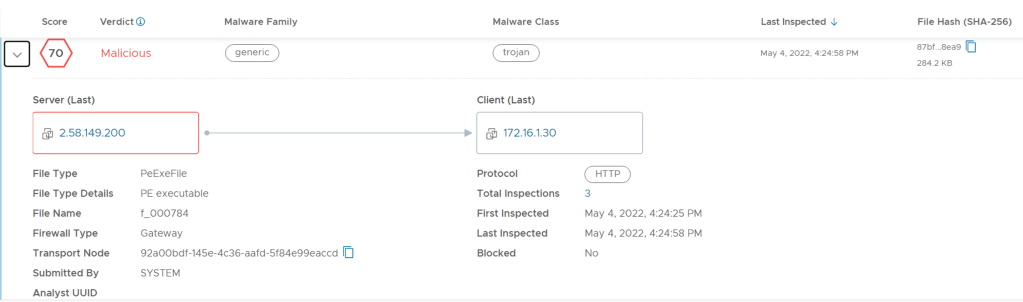
Test 1 – File Download from the Internet on My Test Server (Win2K – 172.16.1.30)
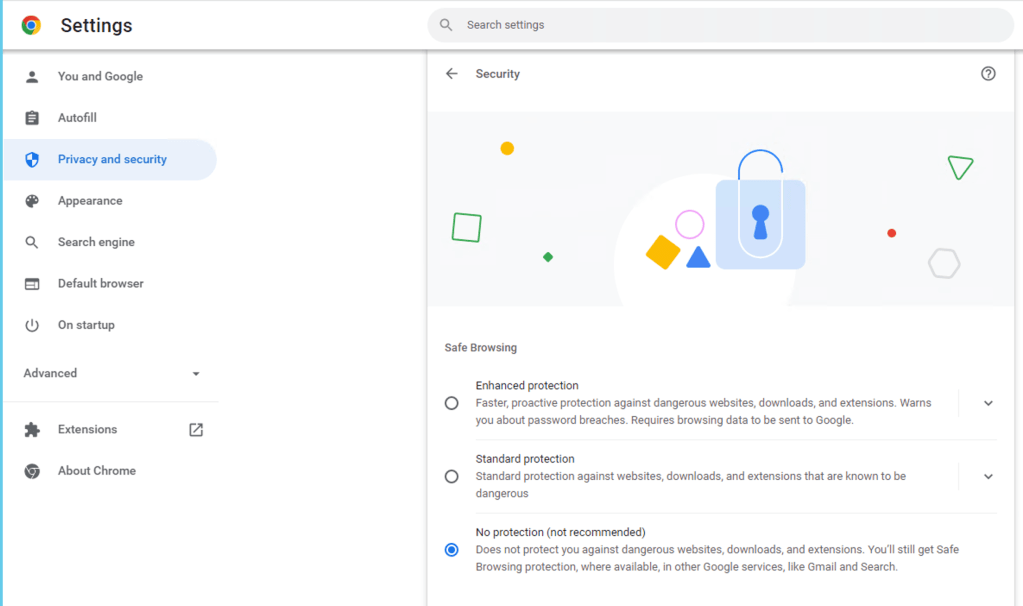
For this test I am using the Chrome browser and I have set the Security settings to “No protection”
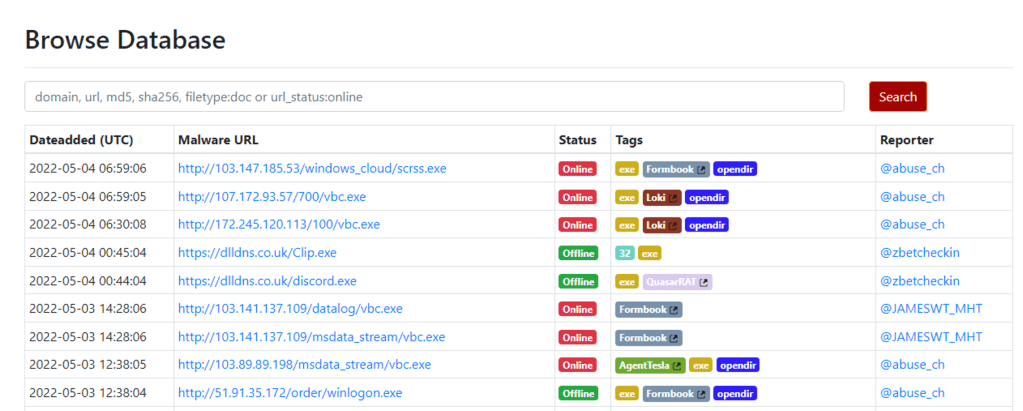
I will be using this site to source well known malicious content hosted out on the Internet (https://urlhaus.abuse.ch/browse)
I suggest you proceed with caution as the links on this site are links to the real deal malicious files.
In the Browse Database search bar I am going to filter to .exe files, you will see the URL’s to the malicious files listed under Malware URL. You need to copy this URL and paste it into a new tab in Chrome to initiate the download of the Malware. Since this is test I will only download the file and NOT down and run the file. ***PERFORM THIS STEP AT YOUR RISK, NOT ALL THE LINKS HERE WORK****
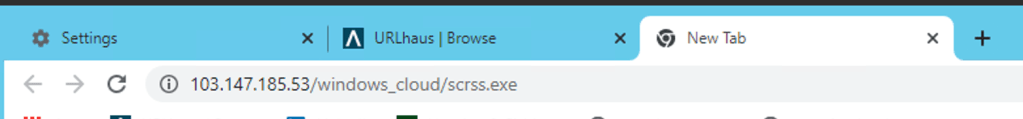
I selected the first URL, copied the link and paste it to a new TAB and you can see the file is downloaded to my machine.
Link to MalwareMalware Downloaded to Windows Machine
Now if you return to the NSX-T Manager and view the events.
NSX-T Manager -> Security -> Malware Prevention
Malware Prevention DashboardMalware Detected
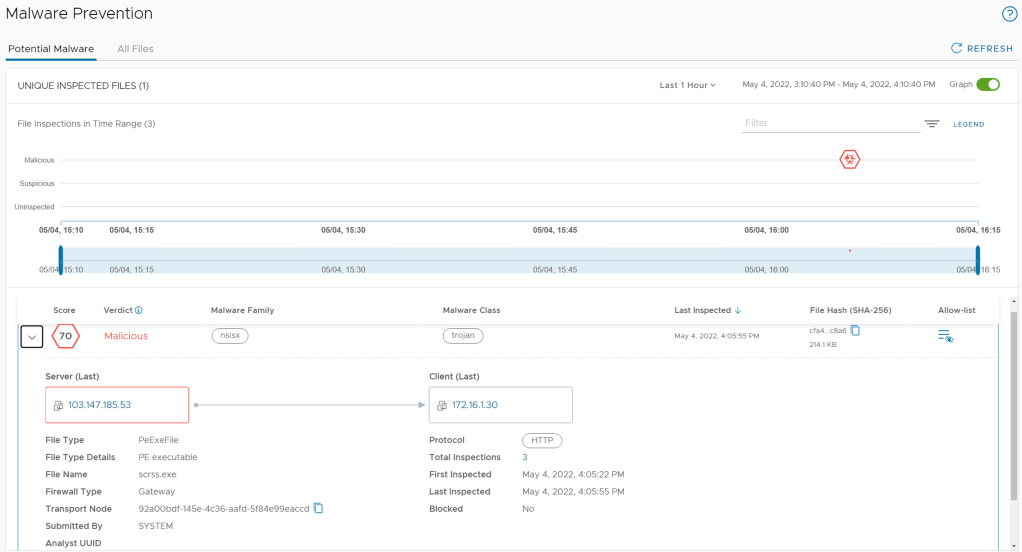
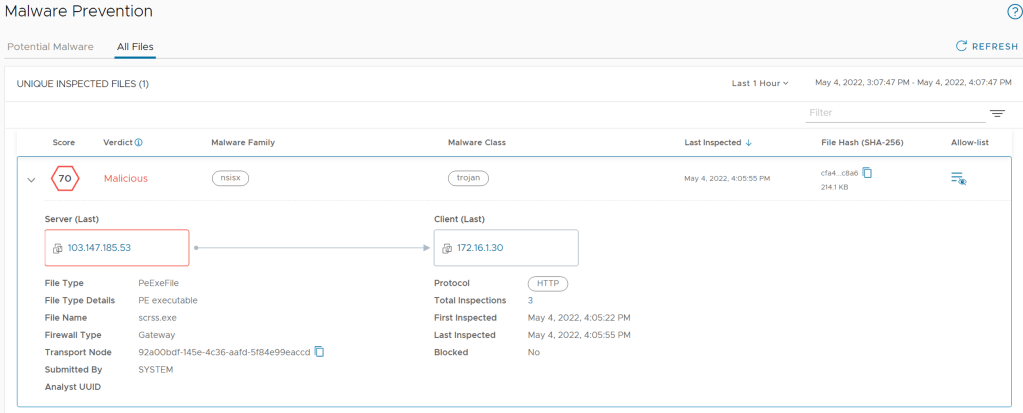
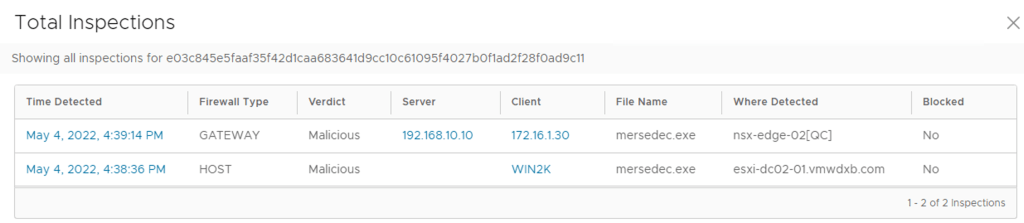
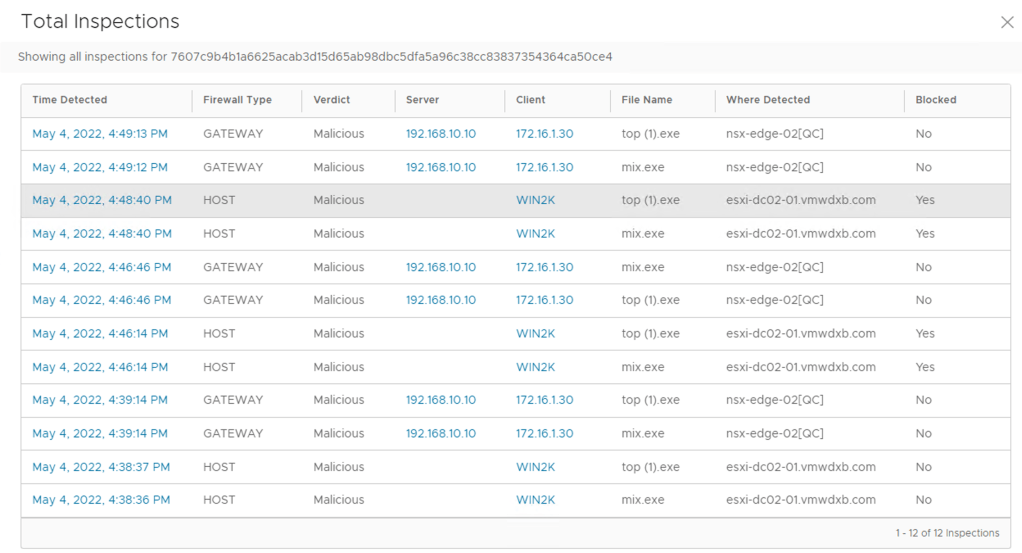
From this you can see that NSX Malware Detection has detected the file downloaded in HTTP and Firewall Type indicates Gateway – This means the Gateway Malware Feature detected the file and the file was not blocked. The file has been identified as Malicious with a score of 70. This is an example of static analysis, the file was identified locally by SVM/Malware Prevention platform and did not need to send the file to the cloud for analysis.
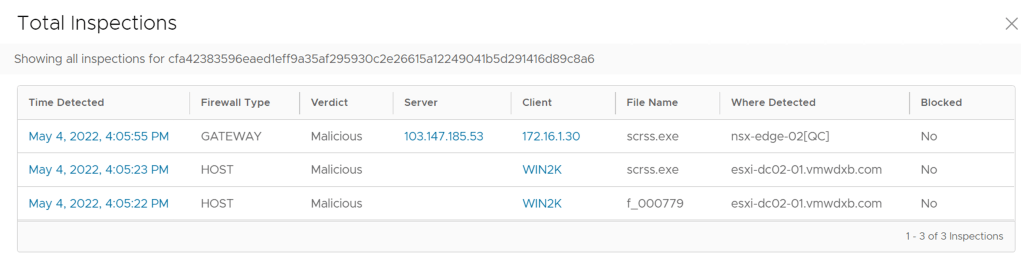
In my case you notice that the file has 3 Total Inspections, if click on the number shown there. It shows me that the file was inspected at the Gateway and on Host and it shows the VM name and ESXi host where the file was detected.
Let me download a few more random files and see if we can trigger the dynamic analysis which will send the malicious file to Cloud for analysis. I tried a few more file downloads and the local static analysis successfully identified each one without the need to send it to the Cloud. Let me search for more.
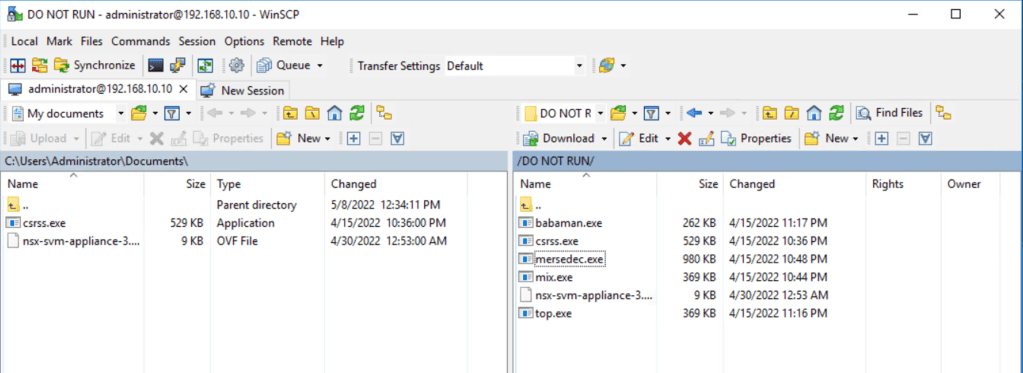
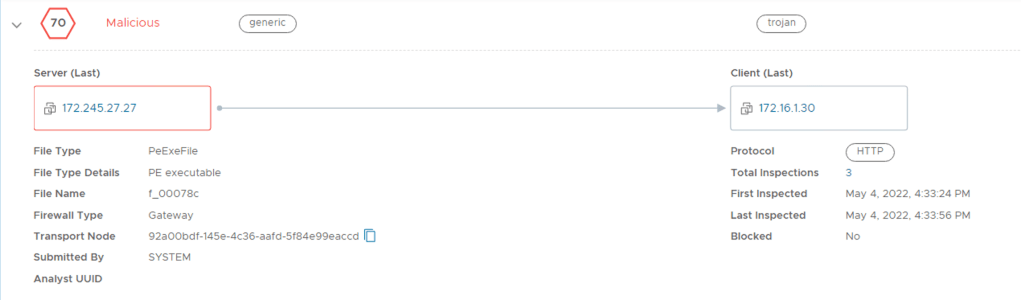
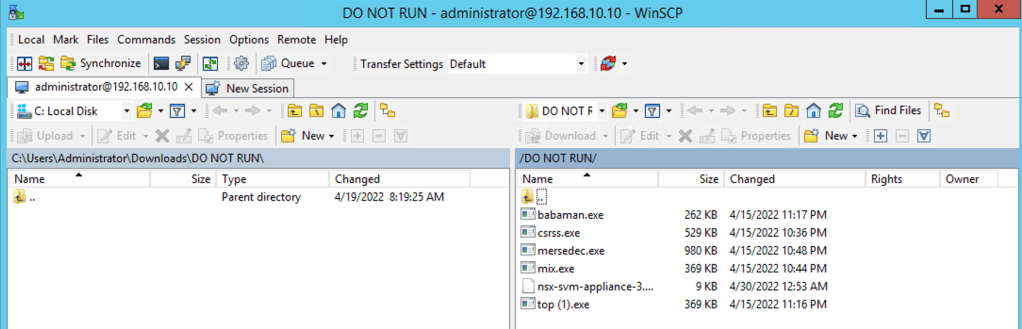
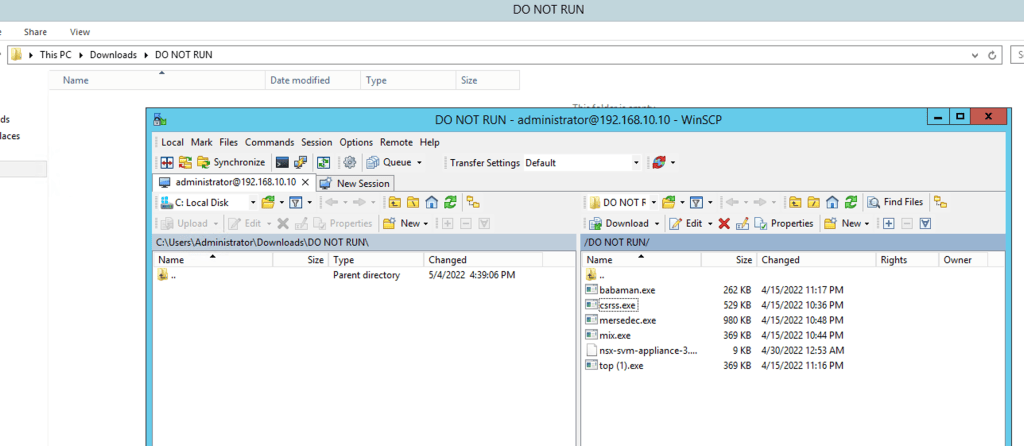
Test 2 – FTP Files from My FTP Server (192.168.10.10) to My Test Server (Win2K – 172.16.1.30)
FTP using WinSCP
I am going to copy the contents of the directory to my Test Server, these are all malicious files which I previously downloaded from the Internet.
File copied over FTP
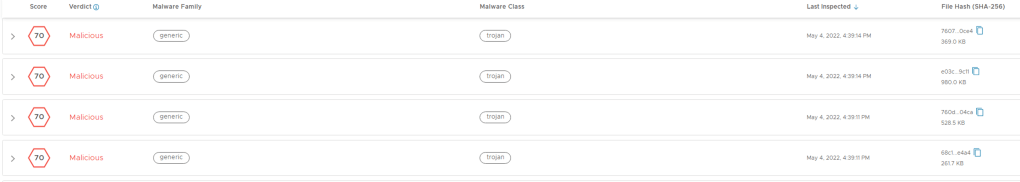
If I go back to the NSX-T Manager, Security -> Malware Prevention -> All Files
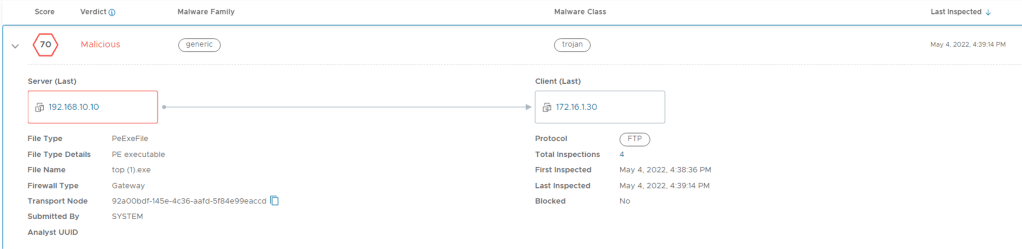
I see the files copied and if I drill into one them, the files were detected in protocol FTP
File Detected in FTP
The file is inspected at the Gateway and the host.
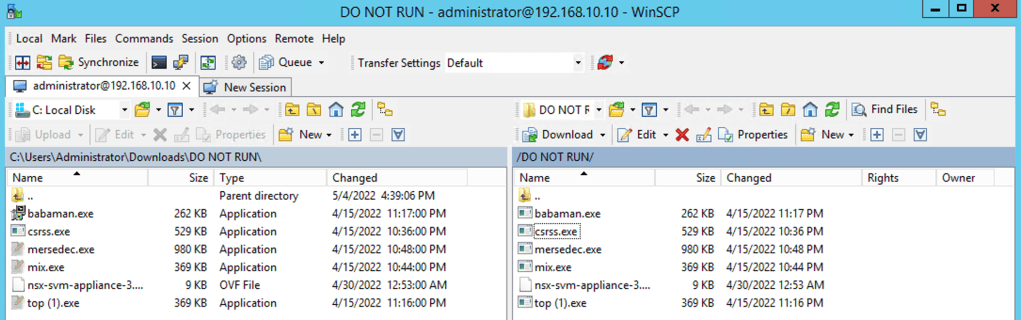
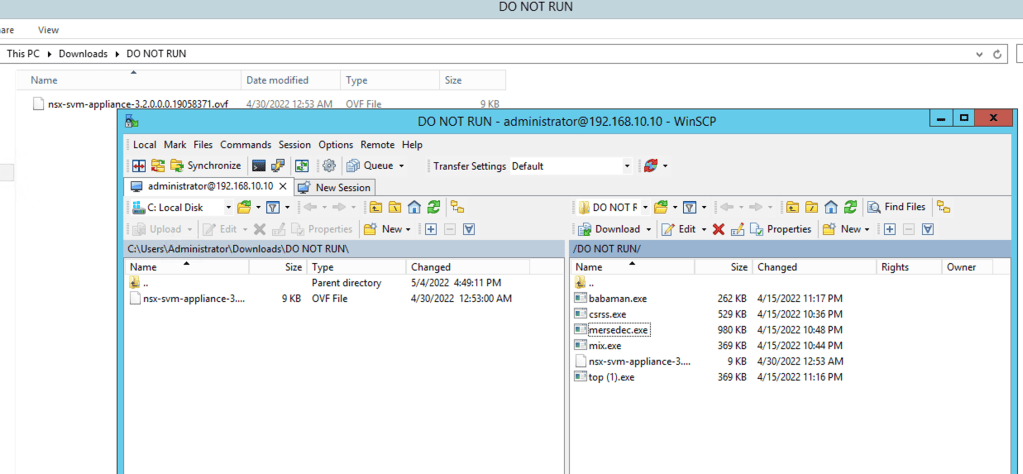
I am going to delete all the files which I copied across from the FTP server from my local Test Server and then try and copy them again – this time I am expecting that the Malware Prevention prevents the files from being copied to my server. The distributed Malware Prevention should now be blocking these files.
Files Deleted from local Server
I select all the files and drag them across to my local directory
Here I noticed that only the OVF file was successfully copied to my local directory
Only the OVF File is copied – Malicious files are prevented
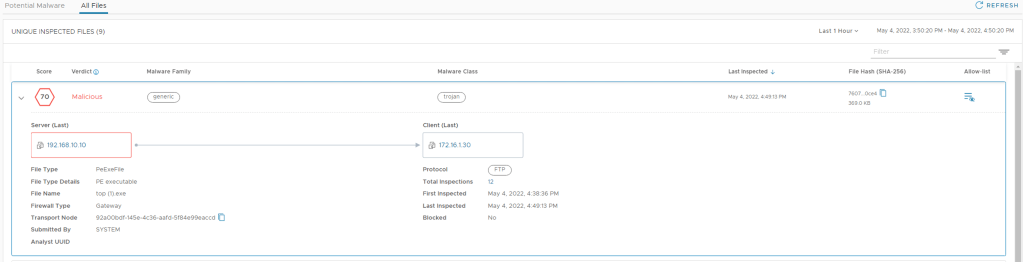
If I go back to the NSX-T Manager and refresh the page and go to Security -> Malware Prevention -> All Files and I expand the first file at the top of the list
Click on the number in the total inspections
Here I can see the files listed and notice the Blocked action is now YES and it was enforced on the host esxi-dc02-01.vmwdxb.com where my Win2K machine is running.
File Inspection Summary
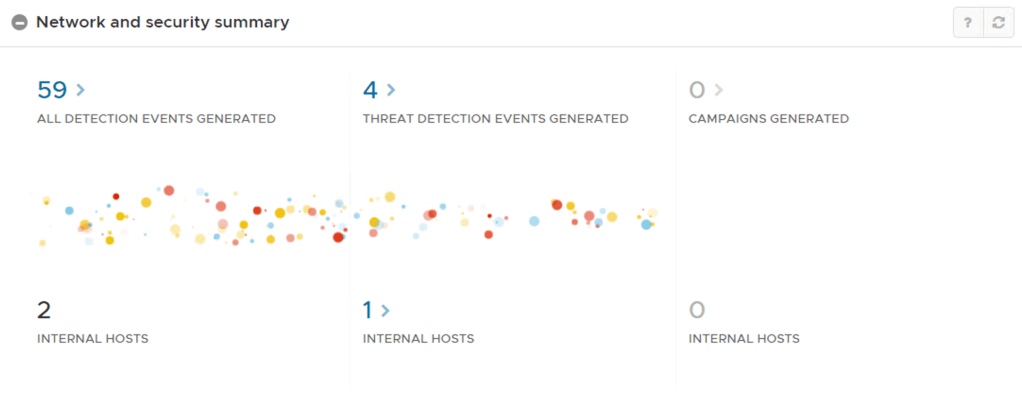
NSX Network Detection and Response Dashboard
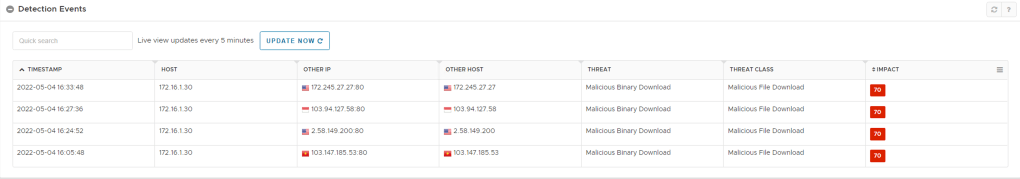
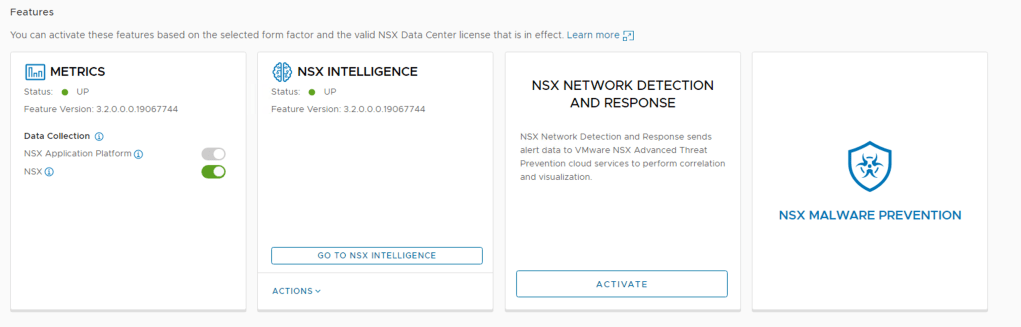
Since NSX IDS/IPS and Malware Prevention feed their events to the NSX Network Detection and Response Component, you can monitor these events from the NDR dashboard too.
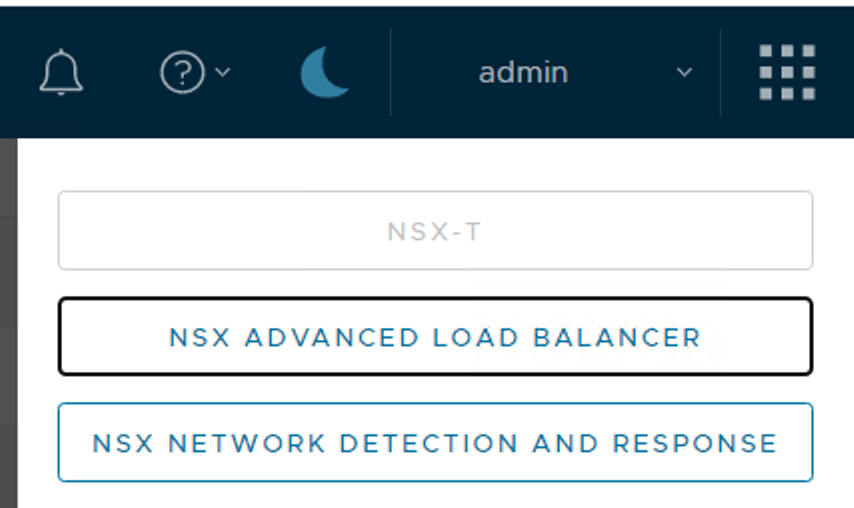
NSX-T Manager -> Home -> Top Right 9 Squares -> NSX Network Detection and Response
Select NSX Network Detection and Response
This open a new page in your browser to the NDR landing page where you will see all event and you can drill down in to the threat detection events
Conclusion
Once the base installation of Malware Prevention with NAPP is done, enabling and demonstrating the capability was fairly straight forward.
While performing Malicious file download tests for the purpose of the blog, all the files I downloaded were successfully identified by static analysis done locally at SVM and NAPP platform.
I will add a piece to the blog showing the dynamic analysis and file sent to the VMware Cloud Sandbox for analysis when I come across file in future demonstrations.
Update
Friday 20 May 2022
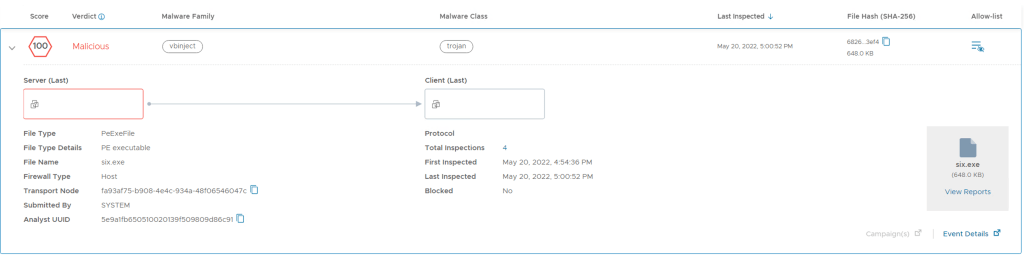
As mentioned at the time of creating this post, I did not match any malware files which needed dynamic analysis done in the VMware Cloud. Fast forward and today I was testing out the updated 3.2.1 upgrade and I have managed to get a file was sent to the cloud for dynamic analysis and it was scored as 100 being Malicious.
You will notice a few extra fields populated Analyst UUID and on the right hand is a report generated.
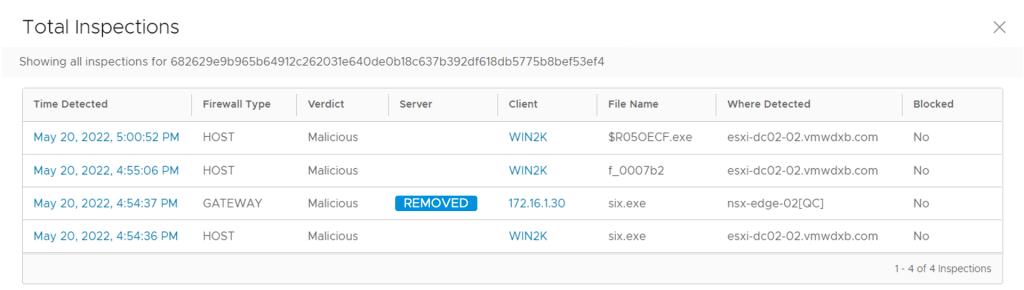
If you click on the value next to Total Inspections, you can expand the details and see where the files was downloaded from, which client it was downloaded too. You will see that the file was inspected at the Gateway and on the host (distributed Malware Prevention SVM)
Total Inspections
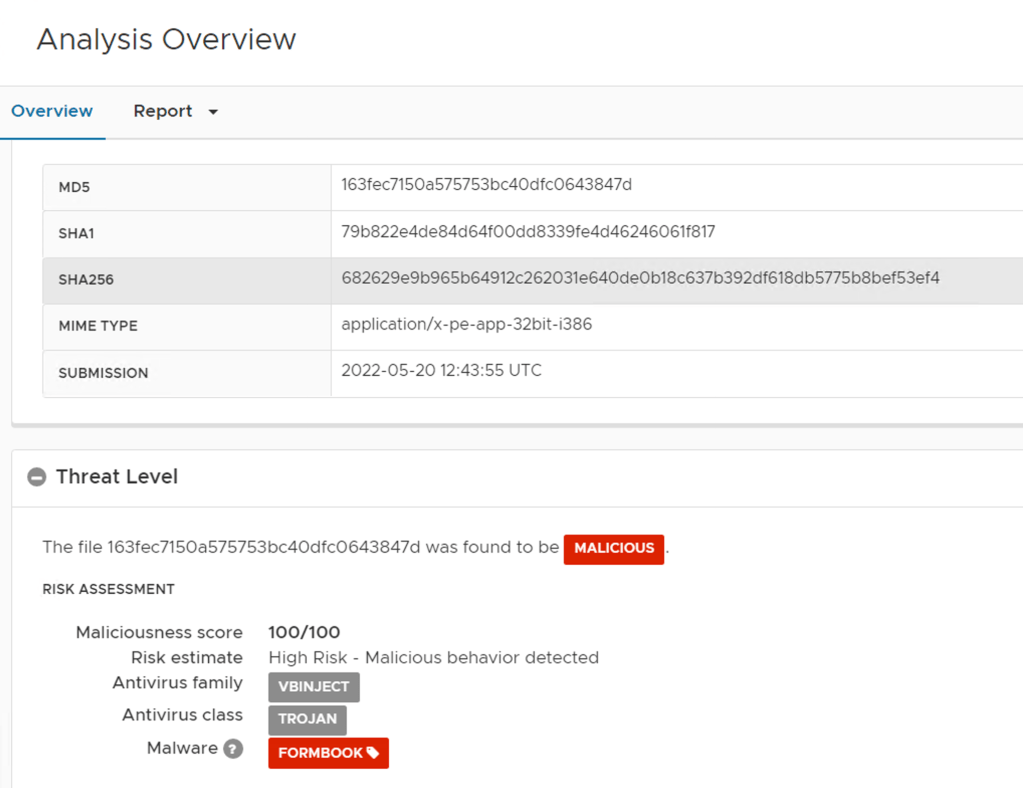
If you click on View Reports, you can find a lot more details about the malware
You can scroll down in the Overview for more details shown below
Or Click on Report and select the OS specific report
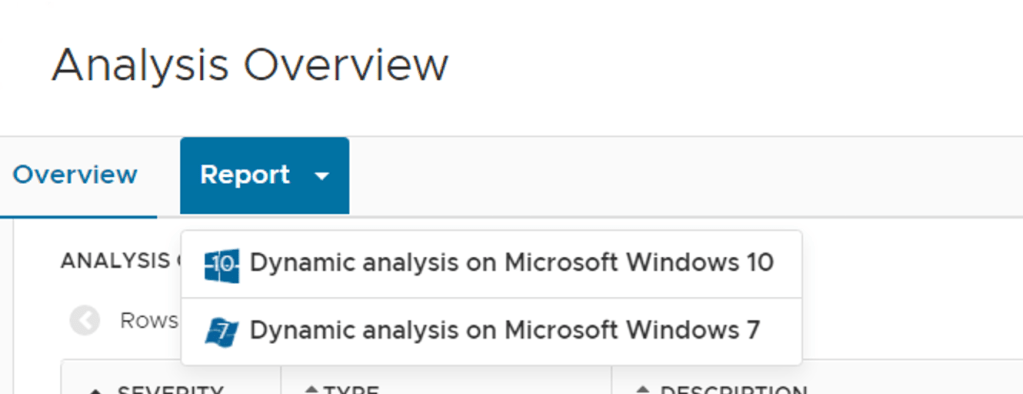
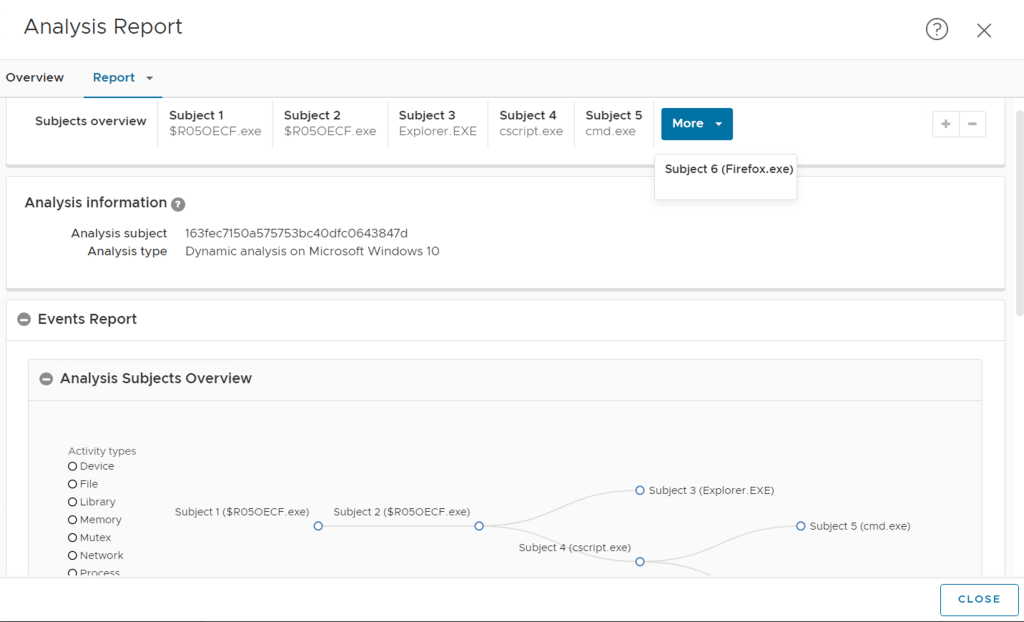
I selected Windows 10 and the report shows me how the malware would proceed from subject to subject
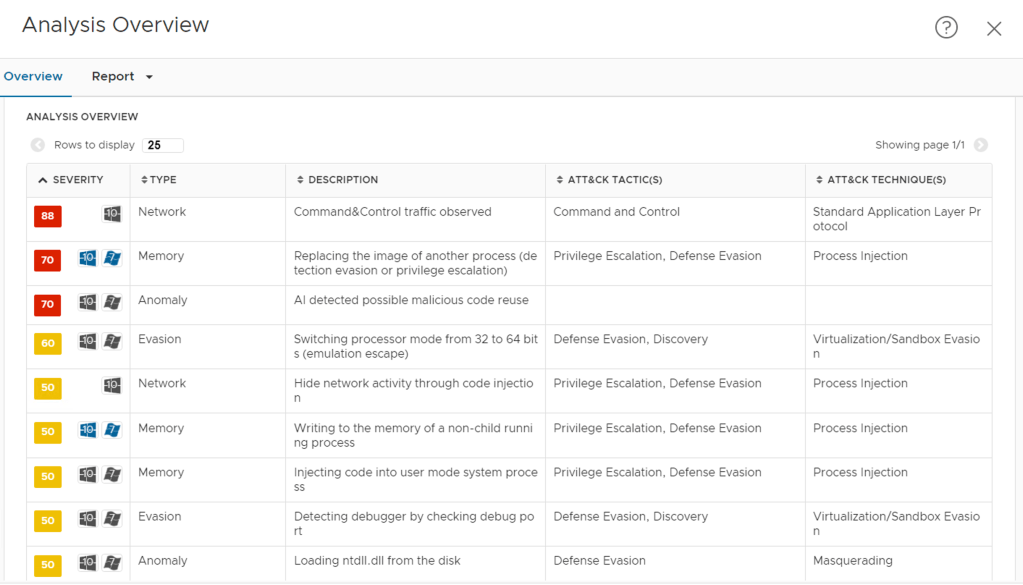
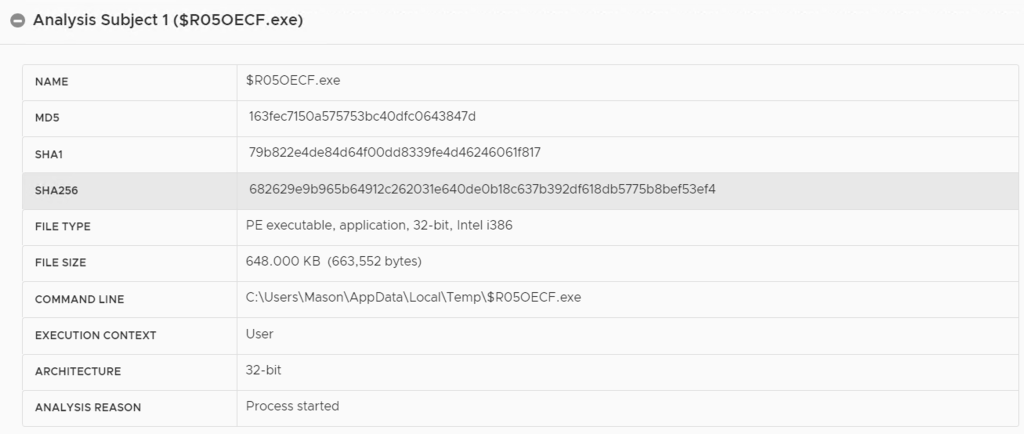
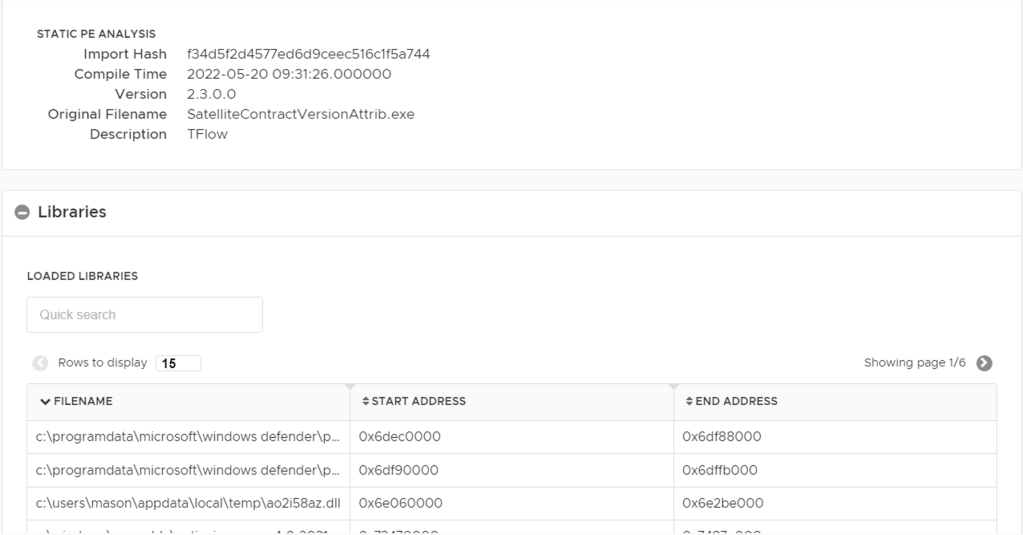
We can drill down to each Subject and see the details – I selected Subject 1
This blog post is intended to guide you on how to enable Network Suspicious Traffic in NSX-T 3.2 to detect suspicious traffic such as abnormal activity and malicious behaviour, across your NSX-T Data Center environment. This feature is now generally available as part of NSX Intelligence 3.2. Since this feature is part of NSX Intelligence, I am assuming you have NSX Application Platform and NSX Intelligence 3.2 already deployed and up and running.
VMware NSX Network Traffic Analysis
Network Traffic Analysis (NTA) is one of the key features which provides input into the VMware Network Detection & Response solution previously covered here.
Overview
In NSX Intelligence 1.2 VMware introduced Network Traffic Analysis in Tech Preview. The feature would help with threat Detections, as represented in MITRE Enterprise Attack Framework. The Initial release included 6 detectors.
Persistence – Traffic drop
Credential Access – LLMNR/NBT-NS Poisoning and Relay (MITRE ID: T1171)
Discovery – Network Service Scanning (MITRE ID: T1046)
Lateral Movement – Remote Services (MITRE ID: T1021)
Lateral Movement – Remote Desktop Protocol (MITRE ID: T1076)
Command and Control – Uncommonly Used Ports (MITRE ID: T1509)
In NSX Intelligence 3.2 released with NSX-T 3.2, Network Traffic Analysis moves from Tech Preview to General Availability and now is available for production environments. VMware expanded the network traffic analysis capability and increased the number of detectors to 14.
Data Upload/Download
Destination IP Profiler
DNS Tunneling
Domain Generation Algorithm
Netflow Beaconing
Port Profiler
Server Port Profiler
Unusual Network Traffic Pattern
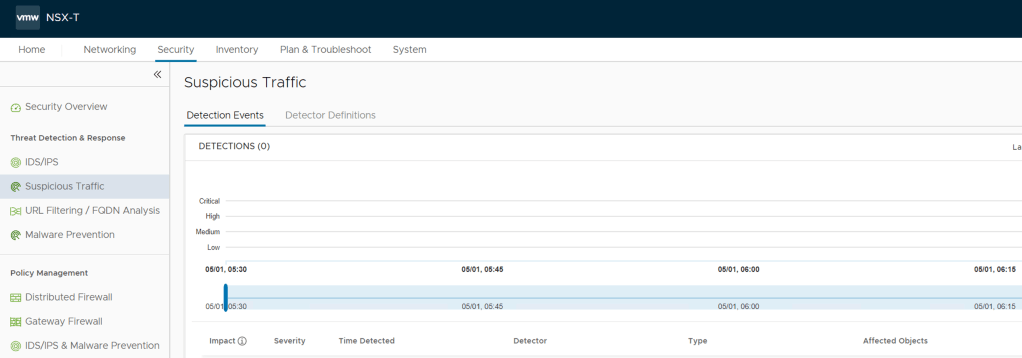
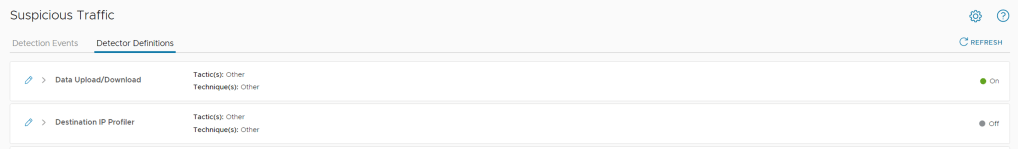
The feature appears in the NSX UI under Security -> Suspicious Traffic
Suspicious Traffic
Getting Started
Use the information in this section to get started using the NSX Suspicious Traffic feature, analyzing detection events, and managing the NSX Suspicious Traffic detector definitions.
You need understand the prerequisites that must be met before you can get started using the NSX Suspicious Traffic feature, if you have NSX Network Application Platform (NAPP) and NSX Intelligence 3.2 already installed and up and running then you just the need the appropriate level of access to the system to enable the detectors.
NOTE: Since Network Traffic Analysis a feature of NSX Intelligence it requires the NSX Enterprise Plus license or one of the NSX Firewall Data Center License options.
NSX Suspicious Traffic feature can start generating network threat analytics on the east-west network traffic flow data that the NSX Intelligence application has collected from your eligible NSX-T workloads (hosts or clusters of hosts). The NSX Intelligence application stores the collected data and persists that data for 30 days. The NSX Suspicious Traffic feature analyzes the data and flags suspicious activities using the supported detectors. You can view the information about the detected threat events using the Detection Events tab of the NSX Suspicious Traffic UI page.
If activated, the NSX Network Detection and Response feature sends the suspicious events to the VMware NSX® Advanced Threat Prevention cloud service for deeper analysis. If the NSX Advanced Threat Prevention service determines that certain suspicious events are related, it correlates those suspicious events into a campaign. The service then organizes the events in that campaign into a timeline and visualizes it on the NSX Network Detection and Response user interface. All threat events are visualized using the NSX Network Detection and Response user interface. The individual threat events and campaigns can be further investigated by your network security team. The NSX Advanced Threat Prevention cloud service fetches periodic updates on the previously detected threats and updates the visualization UI screens when needed.
Detectors
Network Traffic Analysis uses Detectors to classify the detected suspicious network traffic. The detections generated by these detectors might be associated to specific techniques or tactics in the MITRE ATT&CK® Framework.
NSX Intelligence 3.2 supports 14 detectors listed below, all of these are disabled by default and can be selectively enabled or disabled.
Detector Categories Used to Detect Suspicious Traffic
Managing Detectors
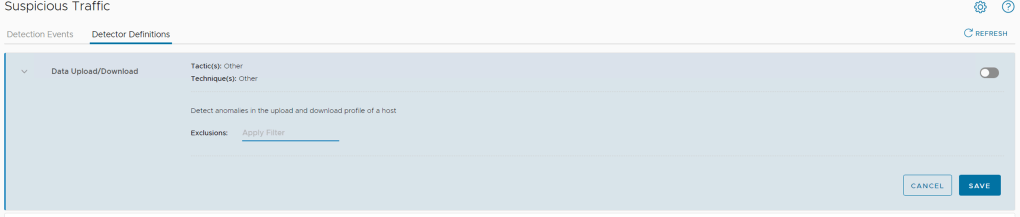
Detectors are selectivity enabled or disabled in the NSX UI under Security -> Suspicious Traffic -> Detector Definitions
You will notice if you take a look on the right hand side of each of the detectors that the status is set off
Detector Definitions
To enable the detectors individually, click on the blue pencil on the left of the detector name, this expands the detector and exposes the toggle on the far right hand side
Detector Definition
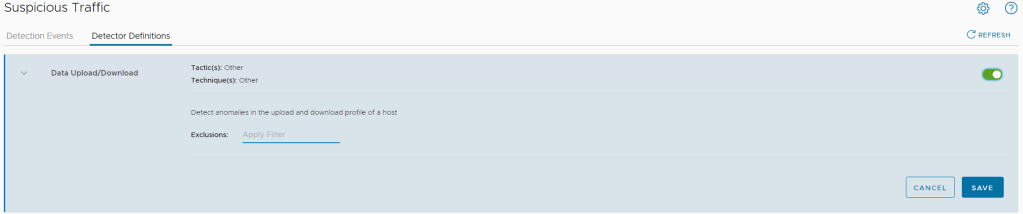
Click on the toggle and should turn green and then click SAVE
Once you click save, it closes the expanded view for that detector and you will see the status now shows On with a green bullet on the right hand side.
Detector Status On
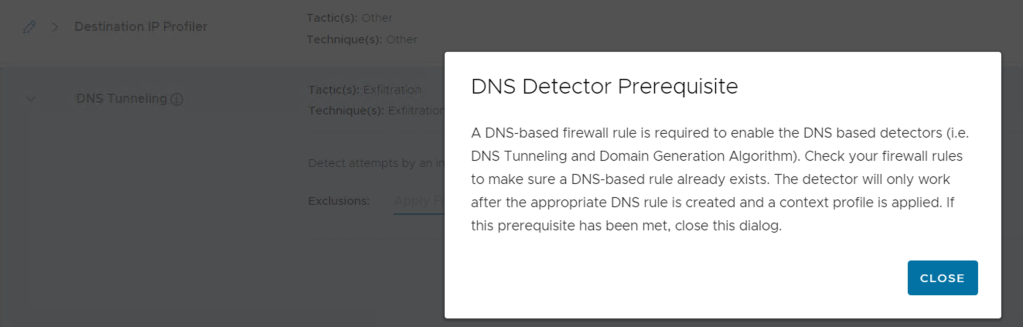
You can now repeat the same step and enable the rest of the detectors one by one. Once you reach the DNS Tunneling and Domain Generation Algorithm detectors you will see this pop up – so make sure to have a L7 DNS rule configured in your Distributed Firewall to trigger this detector. Configuration shown further below.
Some detectors have extended capabilities as the case with LLMNR/NBT-NS Poisoning and Relay – you can adjust the probability meter. I just left them default for this use case
LLMNR/NBT-NS Poisoning and Relay
NOTE: Two of the detectors have been identified to cause unexpected behaviour in the NSX-T 3.2 and should be avoided
Horizontal Port Scan
Uncommonly Used Port
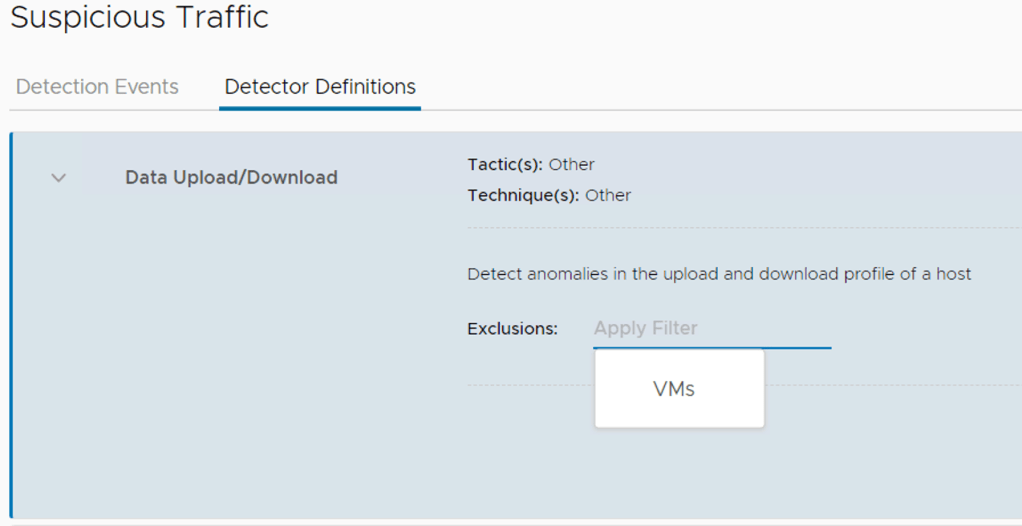
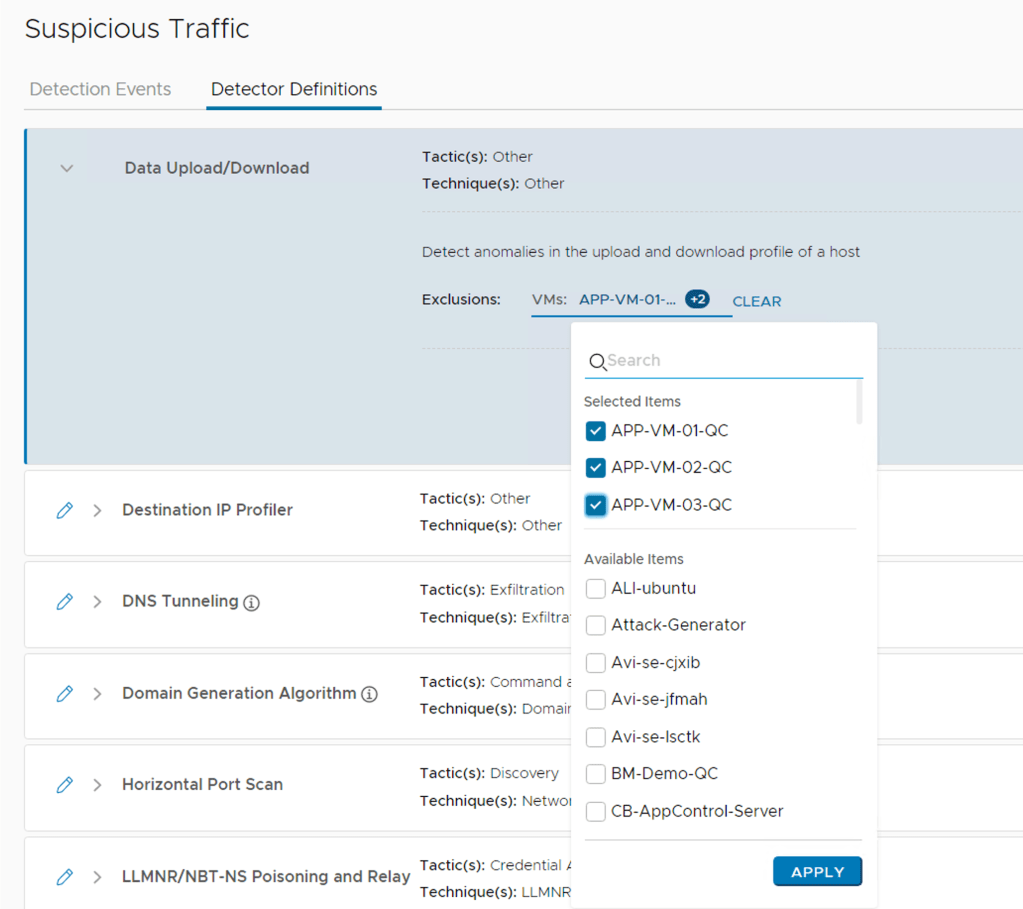
Exclusions – Define the Exclusion list.
Each detector has an additional option to exclude selected Groups or Virtual Machines, I found that some detectors provide the option to select VM’s or Groups and others only provide the option to select VM’s individually.
Detector Definition – Exclusions
Click on the Exclusions greyed out “Apply Filter” and it pops up a box “VMs” and if you click on this it opens the inventory of Virtual Machines exposed to your installation.
Select the Virtual Machines you want to exclude and click Apply.
Selectively exclude VM’s
Configure L7 DFW rule for select detectors
I created the L7 DNS Distributed Firewall rule under the infrastructure section since this requirements is shared with NTA and URL Filtering / FQDN Analysis feature.
Remember to configure the L4 Services as well as the L7 Content Profile for DNS in this rule.
L7 DNS RULE
NTA Learning & Detection Modes
Most of the Network Traffic Analysis detectors do have a learning and detection mode
Learning mode wait time determines number of days of flow records collected by NSX Intelligence needed before detector can detect anomalies
Length of the learning mode depends on the individual detector
Learning mode wait time starts when NSX Intelligence flow collection is configured
Detector Name
Learning Mode (wait time)
Data Upload/Download
None
Destination IP Profiler
8 days
DNS Tunneling
None
Domain Generation Algorithm (DGA)
None
Horizontal Port Scan
None
LLMNR/NBT-NS Poisoning and Relay
20 days
Netflow Beaconing
None
Network Traffic Drop
20 days
Port Profiler
3 Days
Server Port Profiler
3 Days
Remote Sevices
20 days
Uncommonly Used Port
None
Unusual Network Traffic Pattern
14 days
Vertical Port Scan
20 days
Network Traffic Analysis in Action
Now that we have enabled all the detectors, how does this look when one of the detectors are triggered?
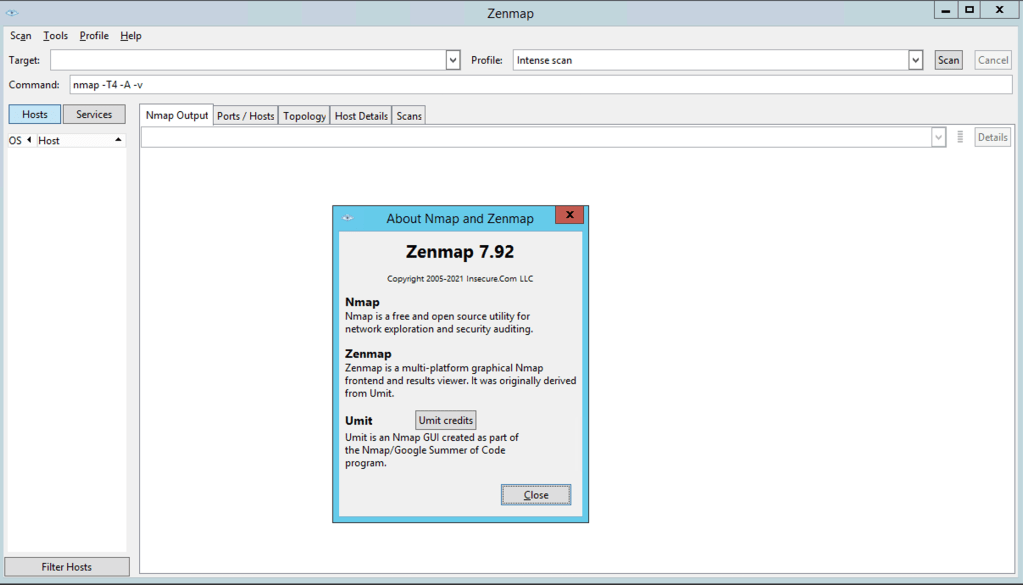
I have a Windows machine connected to my demo environment below running Zenmap 7.92. I will use Zenmap and run some port scans on the subnets in my environment to generate some traffic which is going to trigger the detectors. My Distributed Firewall is allowing full access from this Windows machines to all these subnets for the purpose of the demonstration.
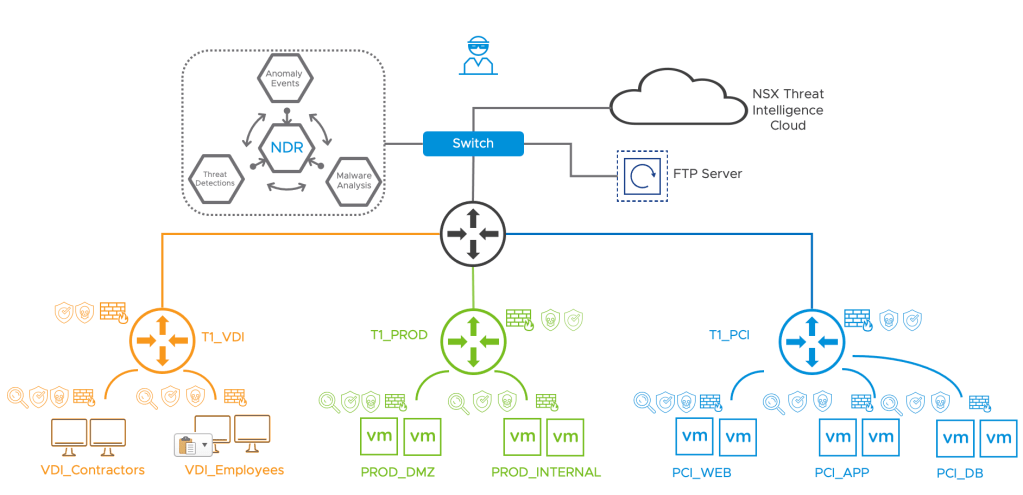
Demo TopologyZenmap UI
My demonstration work loads are connected to the following Subnets:
172.16.1.0/24 – VDI
172.16.10.0/24 – PCI_Web
172.16.20.0/24 – PCI_App
172.16.30.0/24 – PCI_DB
172.16.220.0/24 – PROD_DMZ
172.16.221.0/24 – PROD_INTERNAL
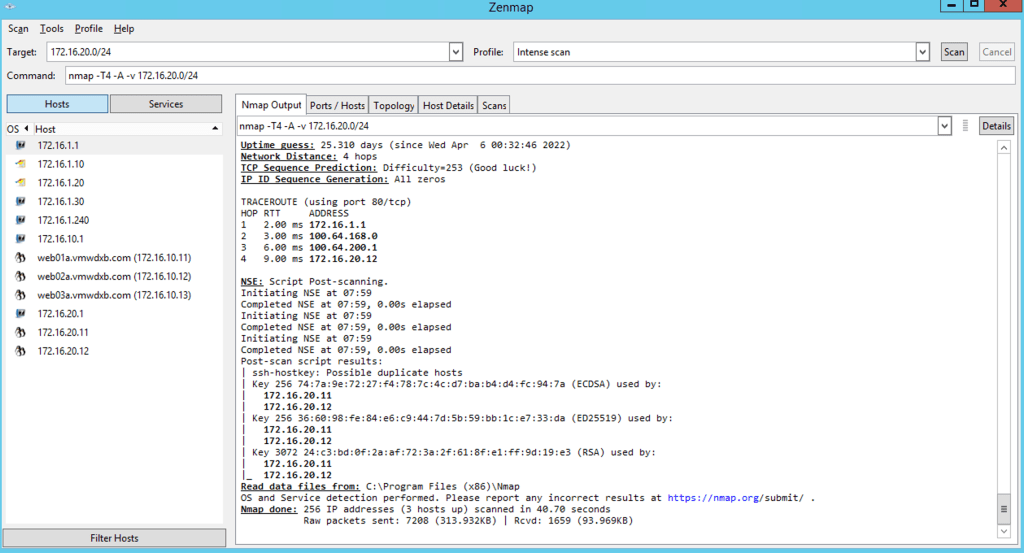
Test 1 – Portscan 172.16.10.0/24 – NMAP discovered the Windows Desktop on this network, some out put shared below. From this information discovered an attacker can easily determine which ports/services are running on your workloads as well as the operating systems and determine the next move to start moving laterally in your environment.
172.16.1.0/24 Intense Scan
Test 2 – Portscan 172.16.10.0/24
172.16.10.0/24 Intense Scan
Test 3 – Portscan 172.16.20.0/24
172.16.20.0/24 Intense Scan
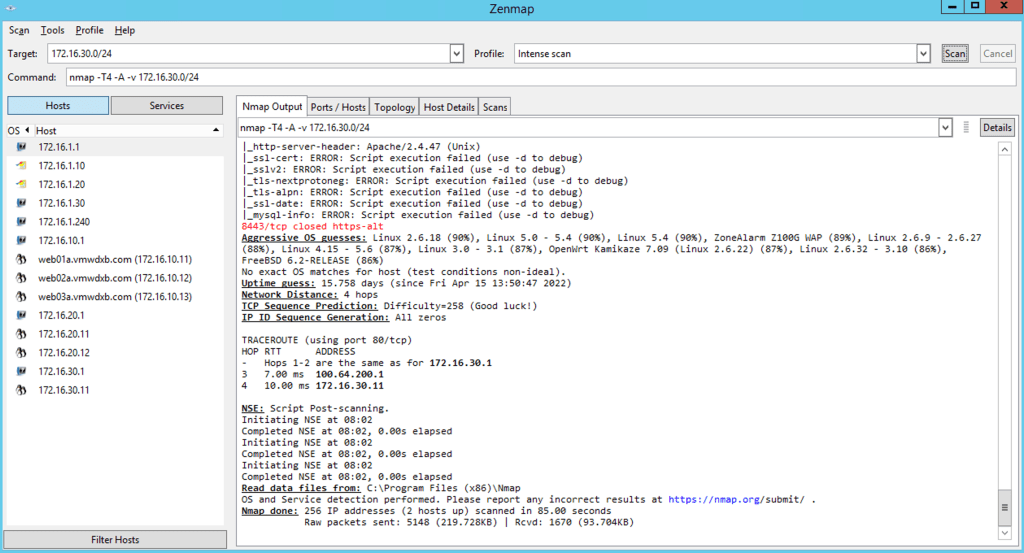
Test 4 – Portscan 172.16.30.0/24
172.16.20.0/24 Intense Scan
From the NSX Intelligence discover and take action dashboard I see all the traffic generated in our tests. I only included a snippet filtered to the test machines WIN2K.
NSX Intelligence Dashboard
Analyzing the NSX Suspicious Traffic Detection Events
Since this was a greenfield deployment, I need to wait the 20 day period for the detectors to pass the learning mode stage and then run NMAP again to see the results in the dashboard.
Port Scan results for the 172.16.220.0/24 network Something to note, the port scan triggered a signature in the distributed NSX IDPS engine which I have applied to my work loads too.
NSX – (Discovery) Detect an SMB Session Setup AndX Request issued by an Nmap instanceNSX – Detect an SMB transaction over the deprecated SMBv1
Note: For detailed information related to Analyzing event visit here
Subscribe to the page to receive the notice when I update the finds with all the outputs from the NSX Manager dashboard once we have passed the learning period.
In this blog post I will cover the installation and activation of the VMware NSX Malware Prevention solution. The activation and deployment will be done on my NSX Application Platform previously deployed. This post will include the deployment requirements and deployment process of the Service Virtual Machines (SVM’s). In a follow-up blog post, I will cover enabling and demonstrating the distributed Malware Prevention and the Gateway Malware Prevention use cases.
Overview – NSX Malware Prevention
This feature detects and prevents malicious files (malware) from entering into your NSX-T Data Center environment and from spreading laterally across the data center. It uses NSX Advanced Threat Prevention cloud services to fetch periodic detection updates and to upload the data for further analysis.
NSX Malware Prevention can detect and prevent known malicious files and unknown malicious files. Unknown malicious files are also referred to as zero-day threats. To detect malware, NSX Malware Prevention uses a combination of the following techniques :
Hash-based detection of known malicious files
Local analysis of unknown files
Cloud analysis of unknown files
In NSX-T Data Center 3.2, NSX Malware Prevention supports the following capabilities:
On the Gateway Firewall, only detection of malware is supported. Both local analysis and cloud analysis of malware files is supported. To view the list of supported file categories, see File Categories Supported for NSX Malware Prevention.
On the Distributed Firewall, malware detection and prevention is supported only for Windows guest endpoints (VMs) running on vSphere host clusters that are prepared for NSX. Only Windows Portable Executable (PE) files are supported for local analysis and cloud analysis. Other file categories are not supported currently by NSX Distributed Malware Prevention.
The supported maximum file size limit is 64 MB.
Getting Started with the Deployment
Let’s cover the base requirements needed to get Malware Prevention Activated and deployed. Part of the deployment is a Service VM that gets deployed on each ESXi host in the vCenter cluster where this capability will be enabled. The SVM leverages the Guest Introspection frame work so currently only supported with Windows workloads and these need to have the required VM Tools drivers installed – more details below.
Requirements
License needed – NSX Malware Prevention security feature is part of the VMware NSX® Advanced Threat Prevention solution.
System
NSX Application Platform must be deployed and the NSX Malware Prevention feature must be activated on the platform.
On Gateway Firewall, NSX Edge VMs with Extra Large form factor must be deployed.
On Distributed Firewall, NSX Malware Prevention service virtual machine must be deployed on vSphere host clusters.
NSX Manager requires Internet Access to validate the license, can be done via Proxy.
VM Tools deployed with NSX Drivers
The Service VM’s require a Management IP which is reachable to the NSX-T Manager and NAPP platform
Each SVM requires 4vCPU, 6GB RAM, 80GB Disk – Not Configurable today.
This deployment is done using NSX-T Version 3.2.0.1.0.19232396
Others
A Web Server to host the OVA of the Service VM, the Malware Prevention OVA needs to be downloaded from VMware’s website.
Postman or similar tool to send some API calls to the NSX-T Manager
NSX Malware Prevention is currently not supported on NSX Edge bare metal and Public Cloud Gateways.
NSX Malware Prevention feature can function as designed only when your NSX-T Data Center is connected to the Internet.
NSX Manager nodes and vSphere hosts must have connectivity to the NSX Application Platform for NSX Malware Prevention to function properly.
Step 1 – Security -> Security Overview -> Malware Prevention -> select GO TO SETUP MALWARE PREVENTION & IDS/IPS
Select Setup Malware Prevention
Step 2 – The UI redirects you to the NAPP Deployment where you will see the option to select Malware Detection at the bottom right.
Go ahead click on NSX MALWARE PREVENTION and click Activate
Select Activate
Step 3 – You will need to run the Pre Checks to validate your license and your Internet access to the VMware Cloud bases solution where files will be sent for dynamic analysis. The option to send files to the cloud can be controlled using the profiles, covered later in the use case demo.
Click RUN PRECHECKS
This step can take some time to finish as the resources get allocated in the background.
NOTE: The same Cloud Region selection is used in both the Malware Protection and the Network Detection and Response features.
Step 4 – Assuming all the Pre Checks pass, you can proceed and click Activate
Malware Prevention Ready for ActivationMalware Prevention setup getting ready
Step 5 – Click on GO TO NSX MALWARE PREVENTION
The activation is now complete as shown below.
Since I have not enabled any Gateway Malware Prevention policies or deployed the Malware Prevention SVM’s for the distributed Malware Prevention capability the dashboard shown below is pretty empty.
Malware Prevention Dashboard
Distributed NSX Malware Prevention
NSX Malware Prevention on a Distributed Firewall uses the NSX Guest Introspection (GI) framework. To detect and prevent malware on the Windows guest endpoints (VMs), you must deploy the NSX Distributed Malware Prevention service on the ESXi host clusters that are prepared for NSX.
To activate NSX Malware Prevention on vSphere host clusters, deploy the NSX Distributed Malware Prevention service on each host cluster.
Note:On the distributed east-west traffic, malware detection and prevention is supported only for Windows Portable Executable (PE) files that are extracted by the GI thin agent on the workload VMs (endpoints). Other file categories are not supported currently by NSX Distributed Malware Prevention. The supported maximum file size limit is 64 MB.
Prerequisites for the SVM Deployment
I am going to assume that NSX-T 3.2.0.1 and above has been correctly installed and all hosts in the cluster you plan to enable this have been prepared with all the NSX bits.
NSX-T Hosts Prepared
Step 1 – Generate Public-Private Key Pair for SSH Access to SVM
To download log file from the SVM for troubleshooting purposes, read-only SSH access to the NSX Malware Prevention SVM is required.
I used PuTTYgen to generate they Public-Private Key. Right Click on the Putty Icon and you see the Run PuTTYgen option. The public key must adhere to a specific format, as described in the following subsection. Examples of SSH key generation tools are: ssh-keygen, PuTTY Key Generator, and so on. Supported key sizes are 1024 bits, 2048 bits, and 4096 bits.
Once PuTTYgen opens it asks you to key moving your mouse cursor around in the box so that it does the random generation and once completed you will see the following output
You are going to need to copy the text from this box to a text file as you going to need this later.
I just saved the Public Key and Private Key to files on my desktop – don’t forget to add a key passphrase first. Store the private key securely. Loss of the private key can lead to a loss of SSH access to the NSX Malware Prevention SVM.
SSH access to the admin user of the SVM is key-based (public-private key pair). A public key is needed when you are deploying the service on an ESXi host cluster, and a private key is needed when you want to start an SSH session to the SVM.
NOTE: NSX Distributed Malware Prevention service deployment is done at the level of a host cluster. So, a key pair is tied to a host cluster. You can create either a new public-private key pair for a service deployment on each cluster, or use a single key pair for service deployments on all the clusters.
Step 2 – Verify VM Hardware Configuration on Guest VMs
Verify that VM Hardware Configuration version 9 or later is running on the Windows guest VMs. Do these steps:
Log in to the vSphere Client.
Go to Hosts and Clusters and navigate to the cluster.
Click the VMs in the cluster, one at a time.
On the Summary page, expand the VM Hardware pane, and observe the Compatibility information of the VM. The VM version number must be 9 or later.
VM Hardware version from my test Windows Machine
Step 3 – Install NSX File Introspection Driver
I would recommend checking this again with our system owners as the default VM Tools deployment does not include installing these drivers.
Step 4 – Download the OVA File of NSX Malware Prevention Service Virtual Machine
At this point we are going to use that Web Server I referred to in the initial system requirements. I believe in future releases this would be made a little simpler but this is what we need to do at the moment.
I used Windows 2012 Server which I was using as FTP Server for vCenter backups and just enabled an IIS page to host the files listed below. See some screen shots of my setup in the steps
Download the OVA file. (VMware-NSX-Malware-Prevention-appliance-3.2.0.0-build_namber.ova)
Extract the OVA file with the following command:tar -xvf filename.ovaReplace filename with the exact name of the OVA file that you downloaded in the previous step.Observe that the following four files are available in the root directory where the OVA file is extracted.
OVF file (.ovf)
Manifest file (.mf)
Certificate file (.cert)
Virtual machine disk file (.vmdk)
Copy all the extracted files to a Web server that meets the following prerequisites:
The Web server must have unauthenticated access over HTTP.
The Web server must be accessible to NSX Manager, all ESXi hosts where you plan to deploy the NSX Malware Prevention SVM, and the vCenter Server that is registered to NSX-T.
The MIME types for the extracted files must be added to the Web server. For information about adding MIME types to the Web server, see your Web server documentation.
My Web Server Setup on Win2012
Copied the 4 extracted files to a directory I named NSXIIS Web Server enabled locallyBindings simply on port 80
Click on the Mimes Icon to add the 4 extension listed above – top right in blue add
Below is an example for adding .ovf and you will need to repeat this steps for the other three list above.
To make sure that your Web server is correctly setup you can test downloading the OVF file by simply browsing to this link.
In my case it was, the link below as I configured the WebServer to point to the directory where I have stored the files on the Windows Server under Basic Settings.
Step 5 – Register the NSX Distributed Malware Prevention Service
Now we are going to need test our API skills using Postman or a similar tool you prefer using to send an API to the NSX-T Manager. This API call will basically instruct the NSX Manager where it will find/download the files it needs to create the SVM which get deployed in a few steps from here.
To make sure that your Web server is correctly setup you can test downloading the OVF file by simply browsing to this link.
Here you are going to need to replace the {webserver-ip}/{path-to-ovf-file}/{filename} details with your Web Server IP and the path and file name. See my example below
Once your Postman API call is ready, hit the SEND button on the right hand side and Postman will connect to the NSX-T Manager API and post those settings. If successful your output should look like this – You want to 200 OK on the right hand side.
Postman Output
Now you can verify that the service name we just created is listed in the NSX Manager.
In NSX Manager, navigate to System > Service Deployments > Catalog.
Verify that the VMware NSX Distributed Malware Prevention Service is listed on the page.
Successfully created Service
For more examples on details how to register the NSX Distributed Malware Prevention Service see this page
Step 5 – Deploy Malware Prevention Service VM’s
Each of the SVM’s will need a Management IP address when deployed, this can be obtained via DHCP or you can create an IP Pool inside NSX Manager and use this pool to allocate IP’s to the SVP’s. Make sure to leave some room in the pool for potential growth in hosts within the cluster since NSX will automatically deploy an SVM when a host is added to the cluster in the future. Make sure this is in place before proceeding else you going to repeat the steps below.
***Each SVM requires 4vCPU, 6GB RAM, 80GB Disk***
I am using a local pool with in my NSX Manager
Now we are going to create a service which would be deploying the Service VM’s on our selected vCenter Cluster – Select VMware NSX Distributed Malware Prevention Service, and click Deploy.
We need to populate some details in the service definition, give your Service deployment a name. I used Malware Prevention Service
Then select the correct vCenter and vSphere cluster with the datastore for your deployment. Select the
Click Edit Networks and populate the data as per your deployment requirements.
Management IP Settings
Now we need to populate the Configure Attributes field, this is the ssh key which we copied from that box when we generated the Public-Private key. The one below:
Output below, click Save on the bottom Right
Populating the Key in the Configure Attribute field
So with all the data populated we can go ahead and save
Now Click OK on the pop up
If all your parameters entered are correct you see the orange “progress” status. Depending on your environment and how many ESXi servers in your vCenter cluster, it could a little bit of time as each SVM is created and deployed.
The NSX Manager is now doing the needed to get the SVM’s deployed on the cluster you specified – hope over to your vCenter and you will see a template folder created ESX Agents. If you expand this you will see the first SVM template being created and deployed in vCenter.
First SVM created
You can also monitor the progress in vCenter under recent tasks, you will see below that all four my hosts in my Compute cluster are in progress.
vCenter Recent taks Output
Once this has completed you should see one SVM per ESXi host in your Cluster, in my case 4 have been deployed.
You can also monitor some progress from the NSX Manager, go to System -> Service Deployments ->Service Instances -> Select VMware NSX Distributed Malware Prevention Service
Service Instances progress from NSX Manager
It does take a little time for all the SVM’s to be deployed, configured and powered up but once this has completed you can see their status from vCenter and the NSX Manager.
In vCenter the SVM is powered up and I can see its connected to the portgroup which I specified and it has an IP from my IP Pool too.
SVM in vCenter
From the NSX Manager if you refresh page in the services instances, if all went well you will see your SVM’s deployment status and health status Up and the dot turn Green
SVM’s Successfully deployed
The Service also shows up on the Service Deployment dashboard
Step 6 – Accessing the Malware Prevention Service VM’s
We are going to need to access the SVM’s from vCenter console and we need the public-private key pair which we generated at the start of this blog.
By default, an admin user on the NSX Malware Prevention service virtual machine (SVM) does not have an SSH access to the SVM. The vCenter Server administrator must activate SSH access to the SVM.
SSH access to the admin user of the SVM is key-based (public-private key pair). A public key is needed when you are deploying the service on an ESXi host cluster, and a private key is needed when you want to start an SSH session to the SVM.
From vCenter -> Hosts & Clusters -> Expand the Cluster where you deployed the SVM’s -> ESX Agents Folder -> Click on the first SVM (VMWare_NSX_Distributed_Malware_Preven (1)
Double Click on the black box on the right or click on Launch Web Console or Launch Remote Console and it should pop up a warning and select Yes
Now in the new window you will have the SVM console access, you need to login here with user root and the default password is vmware
First Access to the SVM
Next step would be to reset the default password for the local user root – take note the first password is the current password vmware and then enter your newly selected password.
Enter current password first – vmware
Enter the new password – note this is a local user root for the SVM and it is not synchronised to the NSX-T Manager root username/password. So take note of the changes and save it somewhere.
Enter New Password
Now we can start the SSH service locally on the SVM using the following:
/etc/init.d/ssh start
SSH started locally on SVM
Now, you can log in to the SVM as an admin user and use the SVM private key to start an SSH session.
Procedure
You can get the Management IP for the SVM’s from vCenter as shown below
Management IP for the SVM
I am going to use Putty to ssh to the first SVM – 192.168.30.20. We need to select the private key for authenticating the SSH session with the SVM. Without this you will not be able to successfully ssh to the SVM.
In the Putty UI scroll down to Connection – > SSH -> Auth -> Click Browse. Select your Private-Key file from your local machine or where you have saved it.
Browse to the location of the Private Key
Click Open to start the SSH session to the SVM
Click Yes
If your key upload was successful, you can enter the username admin and you will be asked for the Passphrase you used when you created the private/public key
Enter Passphrase
Once the correct Passphrase is entered you now have admin access to the SVM local CLI.
Remember to repeat these steps on all the SVM’s in your cluster
Conclusion
Now that I have the Malware Prevention SVM’s successfully deployed, I can start with the Policy creations. I will cover this in the next blog.
I hope this was helpful and managed to get your environment ready to see the new NSX Malware Prevention feature in action.