This blog post is intended to guide you on how to enable Network Suspicious Traffic in NSX-T 3.2 to detect suspicious traffic such as abnormal activity and malicious behaviour, across your NSX-T Data Center environment. This feature is now generally available as part of NSX Intelligence 3.2. Since this feature is part of NSX Intelligence, I am assuming you have NSX Application Platform and NSX Intelligence 3.2 already deployed and up and running.

Network Traffic Analysis (NTA) is one of the key features which provides input into the VMware Network Detection & Response solution previously covered here.
Overview
In NSX Intelligence 1.2 VMware introduced Network Traffic Analysis in Tech Preview. The feature would help with threat Detections, as represented in MITRE Enterprise Attack Framework. The Initial release included 6 detectors.
- Persistence – Traffic drop
- Credential Access – LLMNR/NBT-NS Poisoning and Relay (MITRE ID: T1171)
- Discovery – Network Service Scanning (MITRE ID: T1046)
- Lateral Movement – Remote Services (MITRE ID: T1021)
- Lateral Movement – Remote Desktop Protocol (MITRE ID: T1076)
- Command and Control – Uncommonly Used Ports (MITRE ID: T1509)
In NSX Intelligence 3.2 released with NSX-T 3.2, Network Traffic Analysis moves from Tech Preview to General Availability and now is available for production environments. VMware expanded the network traffic analysis capability and increased the number of detectors to 14.
- Data Upload/Download
- Destination IP Profiler
- DNS Tunneling
- Domain Generation Algorithm
- Netflow Beaconing
- Port Profiler
- Server Port Profiler
- Unusual Network Traffic Pattern
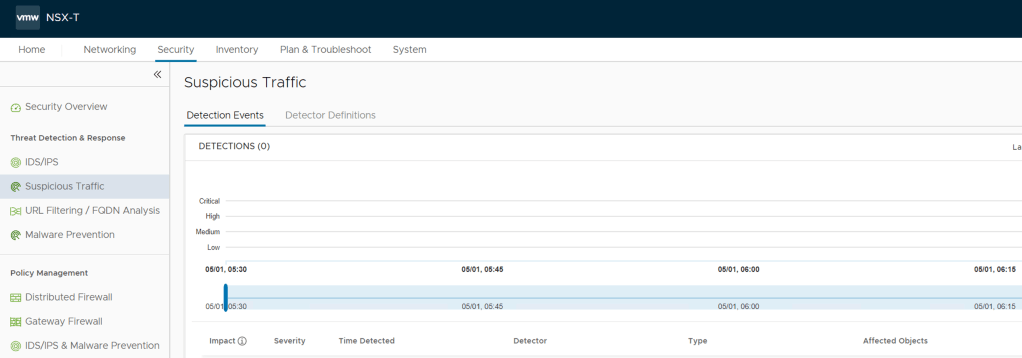
The feature appears in the NSX UI under Security -> Suspicious Traffic
Getting Started
Use the information in this section to get started using the NSX Suspicious Traffic feature, analyzing detection events, and managing the NSX Suspicious Traffic detector definitions.
You need understand the prerequisites that must be met before you can get started using the NSX Suspicious Traffic feature, if you have NSX Network Application Platform (NAPP) and NSX Intelligence 3.2 already installed and up and running then you just the need the appropriate level of access to the system to enable the detectors.
Prerequisites for Using the NSX Suspicious Traffic Feature
NOTE: Since Network Traffic Analysis a feature of NSX Intelligence it requires the NSX Enterprise Plus license or one of the NSX Firewall Data Center License options.

How it Works
NSX Suspicious Traffic feature can start generating network threat analytics on the east-west network traffic flow data that the NSX Intelligence application has collected from your eligible NSX-T workloads (hosts or clusters of hosts). The NSX Intelligence application stores the collected data and persists that data for 30 days. The NSX Suspicious Traffic feature analyzes the data and flags suspicious activities using the supported detectors. You can view the information about the detected threat events using the Detection Events tab of the NSX Suspicious Traffic UI page.
If activated, the NSX Network Detection and Response feature sends the suspicious events to the VMware NSX® Advanced Threat Prevention cloud service for deeper analysis. If the NSX Advanced Threat Prevention service determines that certain suspicious events are related, it correlates those suspicious events into a campaign. The service then organizes the events in that campaign into a timeline and visualizes it on the NSX Network Detection and Response user interface. All threat events are visualized using the NSX Network Detection and Response user interface. The individual threat events and campaigns can be further investigated by your network security team. The NSX Advanced Threat Prevention cloud service fetches periodic updates on the previously detected threats and updates the visualization UI screens when needed.
Detectors
Network Traffic Analysis uses Detectors to classify the detected suspicious network traffic. The detections generated by these detectors might be associated to specific techniques or tactics in the MITRE ATT&CK® Framework.
NSX Intelligence 3.2 supports 14 detectors listed below, all of these are disabled by default and can be selectively enabled or disabled.

Managing Detectors
Detectors are selectivity enabled or disabled in the NSX UI under Security -> Suspicious Traffic -> Detector Definitions
You will notice if you take a look on the right hand side of each of the detectors that the status is set off

To enable the detectors individually, click on the blue pencil on the left of the detector name, this expands the detector and exposes the toggle on the far right hand side
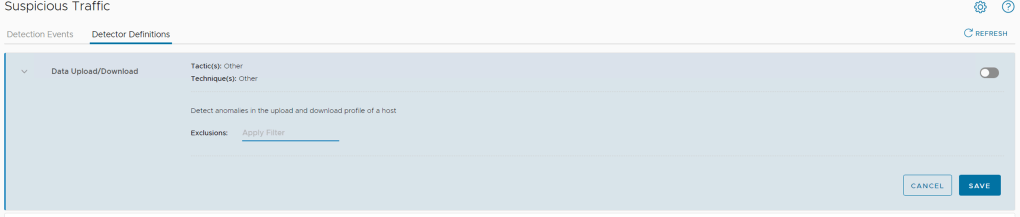
Click on the toggle and should turn green and then click SAVE
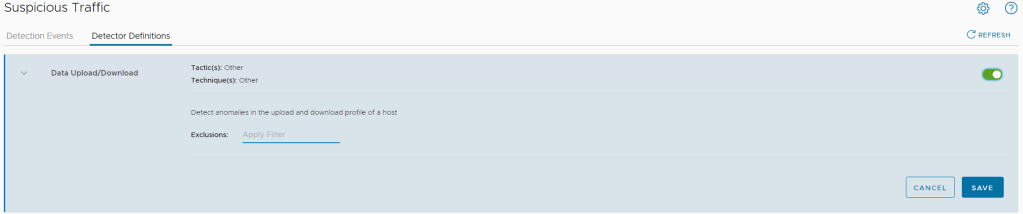
Once you click save, it closes the expanded view for that detector and you will see the status now shows On with a green bullet on the right hand side.
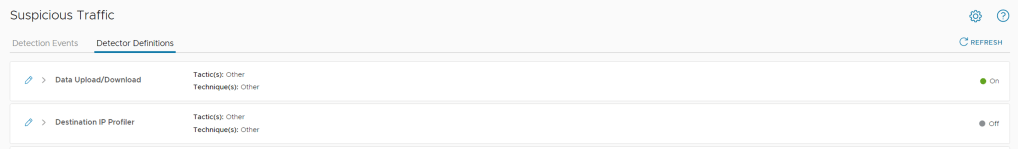
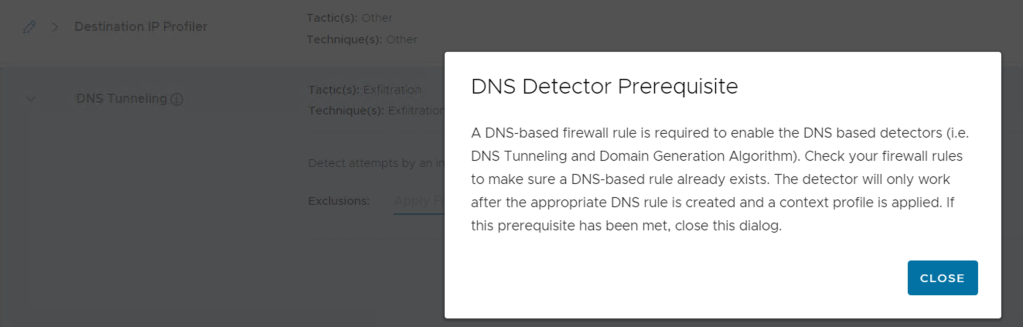
You can now repeat the same step and enable the rest of the detectors one by one. Once you reach the DNS Tunneling and Domain Generation Algorithm detectors you will see this pop up – so make sure to have a L7 DNS rule configured in your Distributed Firewall to trigger this detector. Configuration shown further below.
Some detectors have extended capabilities as the case with LLMNR/NBT-NS Poisoning and Relay – you can adjust the probability meter. I just left them default for this use case

NOTE: Two of the detectors have been identified to cause unexpected behaviour in the NSX-T 3.2 and should be avoided
- Horizontal Port Scan
- Uncommonly Used Port
Exclusions – Define the Exclusion list.
Each detector has an additional option to exclude selected Groups or Virtual Machines, I found that some detectors provide the option to select VM’s or Groups and others only provide the option to select VM’s individually.
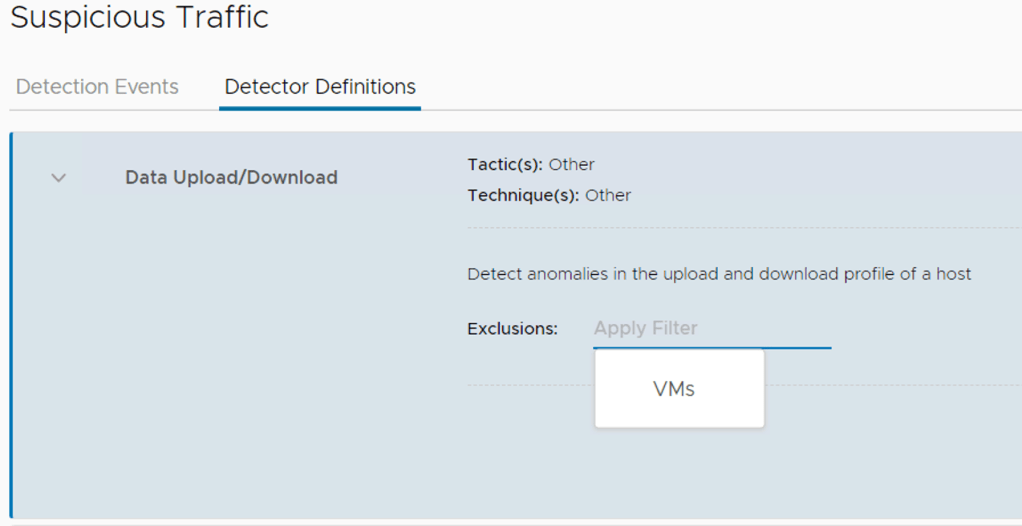
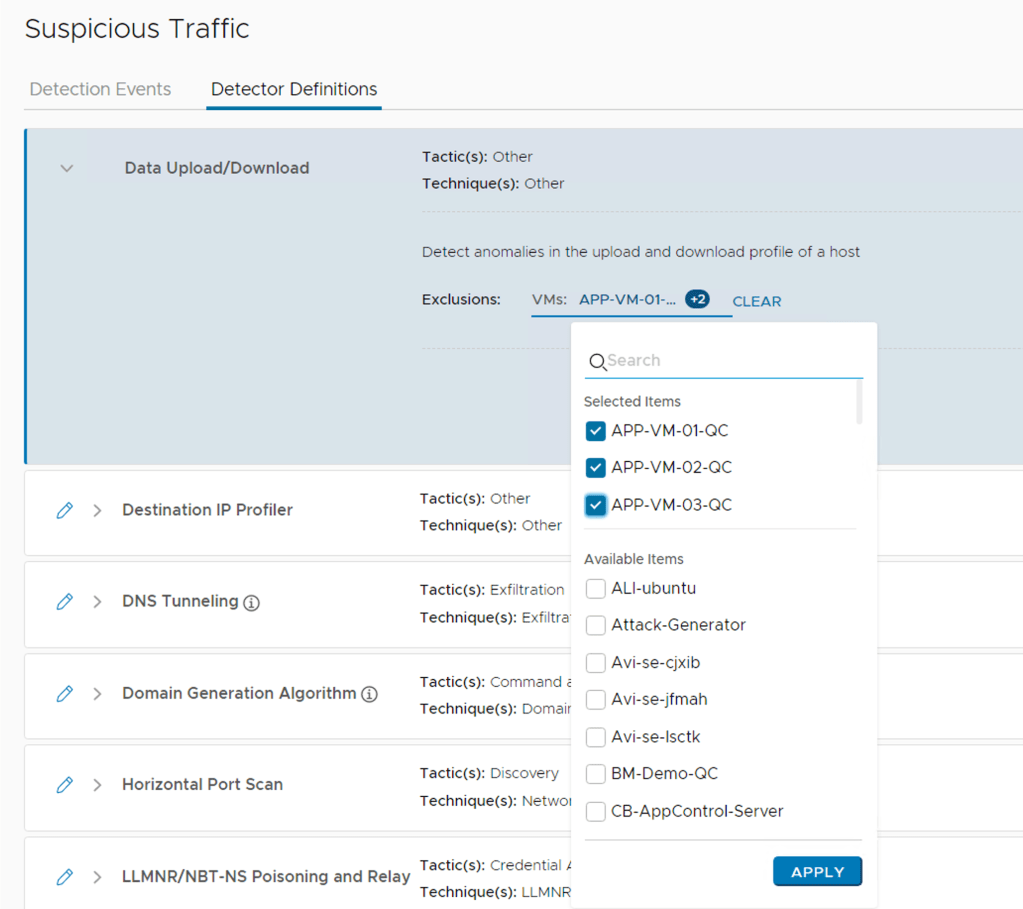
Click on the Exclusions greyed out “Apply Filter” and it pops up a box “VMs” and if you click on this it opens the inventory of Virtual Machines exposed to your installation.

Select the Virtual Machines you want to exclude and click Apply.
Configure L7 DFW rule for select detectors
I created the L7 DNS Distributed Firewall rule under the infrastructure section since this requirements is shared with NTA and URL Filtering / FQDN Analysis feature.
Remember to configure the L4 Services as well as the L7 Content Profile for DNS in this rule.

NTA Learning & Detection Modes
- Most of the Network Traffic Analysis detectors do have a learning and detection mode
- Learning mode wait time determines number of days of flow records collected by NSX Intelligence needed before detector can detect anomalies
- Length of the learning mode depends on the individual detector
- Learning mode wait time starts when NSX Intelligence flow collection is configured
| Detector Name | Learning Mode (wait time) |
| Data Upload/Download | None |
| Destination IP Profiler | 8 days |
| DNS Tunneling | None |
| Domain Generation Algorithm (DGA) | None |
| Horizontal Port Scan | None |
| LLMNR/NBT-NS Poisoning and Relay | 20 days |
| Netflow Beaconing | None |
| Network Traffic Drop | 20 days |
| Port Profiler | 3 Days |
| Server Port Profiler | 3 Days |
| Remote Sevices | 20 days |
| Uncommonly Used Port | None |
| Unusual Network Traffic Pattern | 14 days |
| Vertical Port Scan | 20 days |
Network Traffic Analysis in Action
Now that we have enabled all the detectors, how does this look when one of the detectors are triggered?
I have a Windows machine connected to my demo environment below running Zenmap 7.92. I will use Zenmap and run some port scans on the subnets in my environment to generate some traffic which is going to trigger the detectors. My Distributed Firewall is allowing full access from this Windows machines to all these subnets for the purpose of the demonstration.
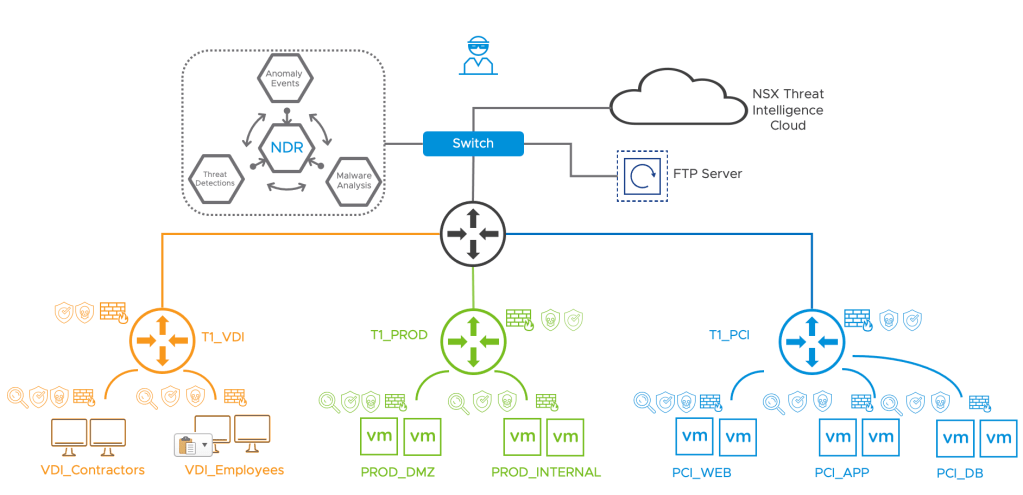
My demonstration work loads are connected to the following Subnets:
- 172.16.1.0/24 – VDI
- 172.16.10.0/24 – PCI_Web
- 172.16.20.0/24 – PCI_App
- 172.16.30.0/24 – PCI_DB
- 172.16.220.0/24 – PROD_DMZ
- 172.16.221.0/24 – PROD_INTERNAL
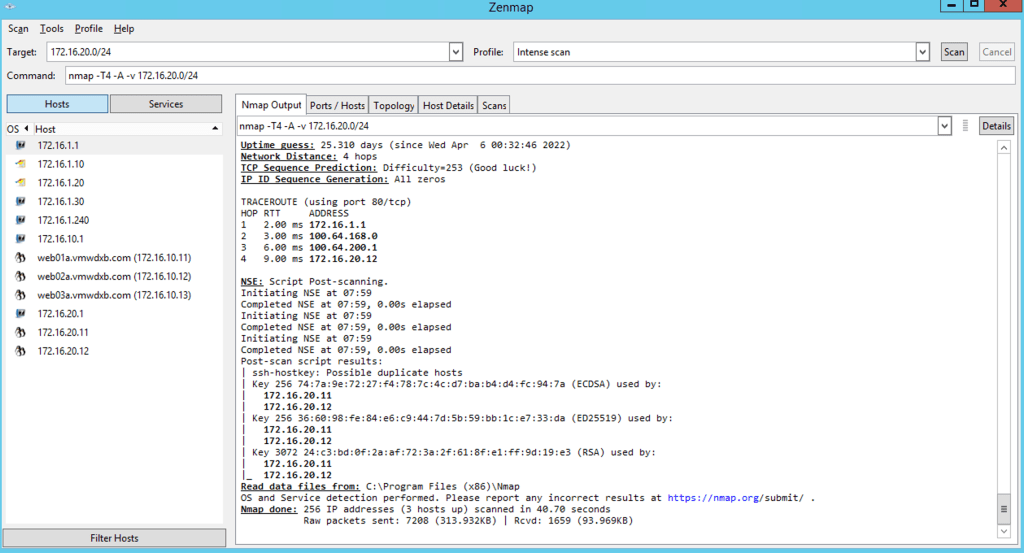
Test 1 – Portscan 172.16.10.0/24 – NMAP discovered the Windows Desktop on this network, some out put shared below. From this information discovered an attacker can easily determine which ports/services are running on your workloads as well as the operating systems and determine the next move to start moving laterally in your environment.

Test 2 – Portscan 172.16.10.0/24

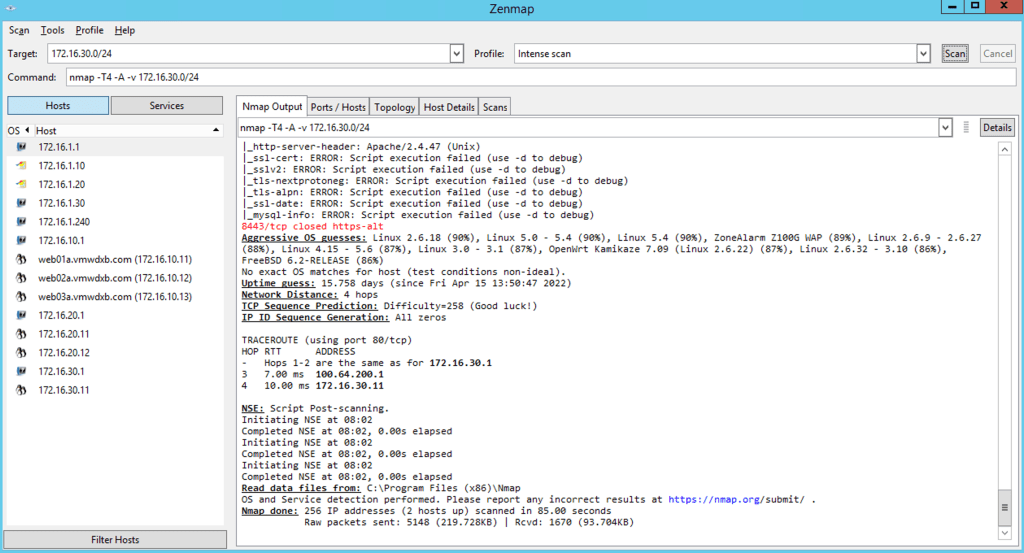
Test 3 – Portscan 172.16.20.0/24
Test 4 – Portscan 172.16.30.0/24
From the NSX Intelligence discover and take action dashboard I see all the traffic generated in our tests. I only included a snippet filtered to the test machines WIN2K.

Analyzing the NSX Suspicious Traffic Detection Events
Since this was a greenfield deployment, I need to wait the 20 day period for the detectors to pass the learning mode stage and then run NMAP again to see the results in the dashboard.
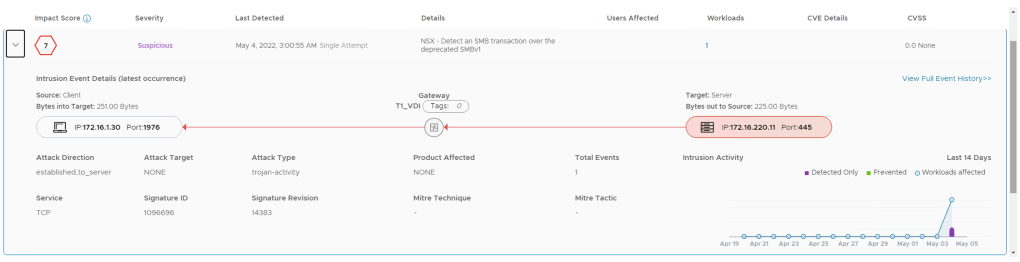
Port Scan results for the 172.16.220.0/24 network
Something to note, the port scan triggered a signature in the distributed NSX IDPS engine which I have applied to my work loads too.

Note: For detailed information related to Analyzing event visit here
Subscribe to the page to receive the notice when I update the finds with all the outputs from the NSX Manager dashboard once we have passed the learning period.

Excellent site you have got here.. It’s difficult to find good quality writing like yours nowadays. I truly appreciate individuals like you! Take care!!
LikeLike