VMware NSX Network Detection & Response 3.2 Deployment

VMware Network Detection & Response

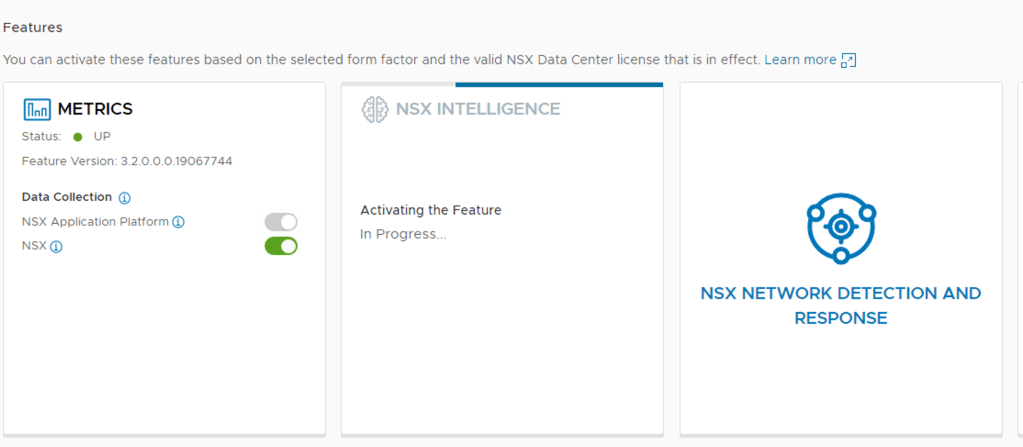
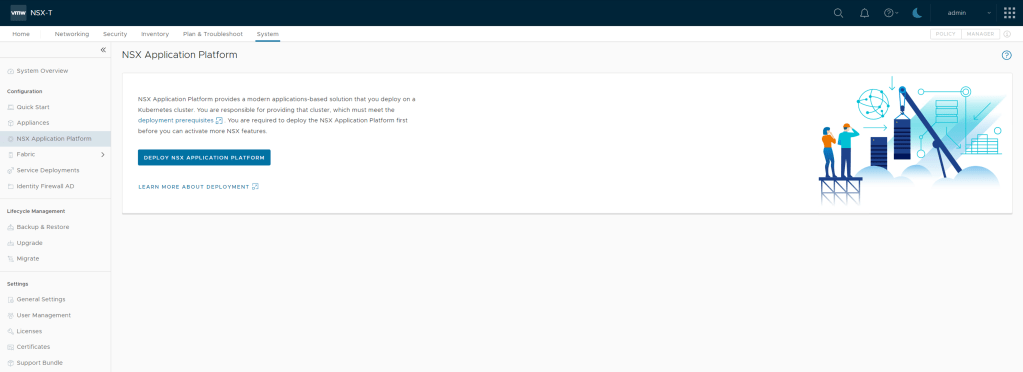
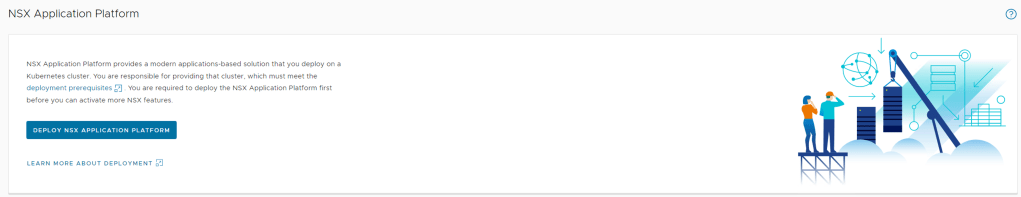
In my previous post I covered the deployment and enabling of NSX Intelligence on our NSX Application Platform. So the next would be enabling the integrated NSX Network Detection & Response (NDR) feature. I say integrated here because VMware offers NDR as a full stand alone deployment option which is based on the Lastline acquisition. NSX-T 3.2 introduces the Integrated solution. This post assumes that the NSX Application Platform (NAPP) has been successfully deployed and you have the required licenses. The post will help guide you activating the NSX-T NDR solution.

The NDR solution in NSX-T 3.2 does not require the deployment of any sensors which is typically required by an NDR solution. NSX-T becomes the sensor monitoring the traffic via NSX Intelligence, leveraging inputs from the NSX Malware Prevention solution and the NSX Intrusion Detection & Prevention and performs all the machine learning and correlation.

The NSX Network Detection and Response feature sends threat alert data to the VMware NSX® Advanced Threat Prevention cloud services, which then performs correlation and visualization on those data using the NSX Network Detection and Response user interface.

Requirements

The feature is available beginning with VMware NSX-T Data Center™ 3.2 and VMware NSX® Intelligence™ 3.2. VMware NSX Application Platform must be installed.

NSX Advanced Threat Prevention License – see these notes on license requirements.

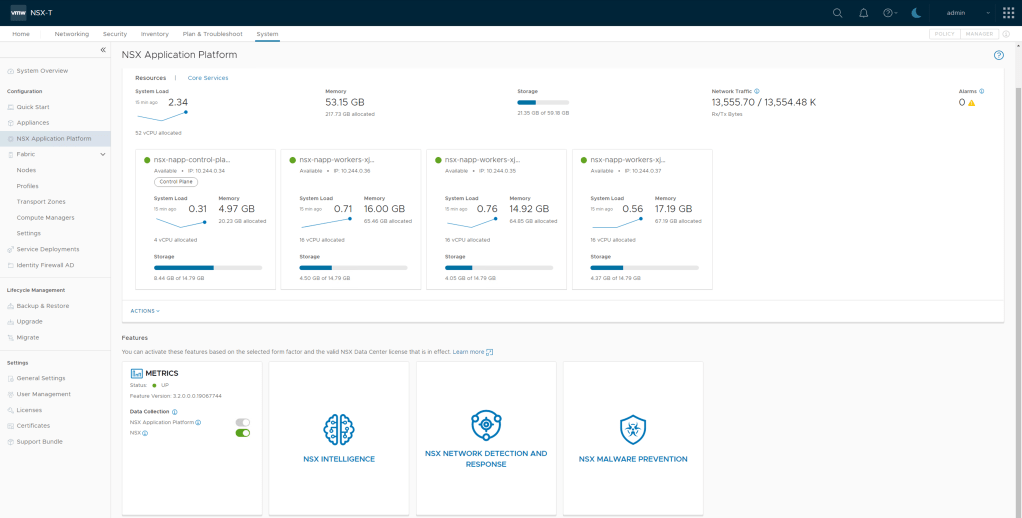
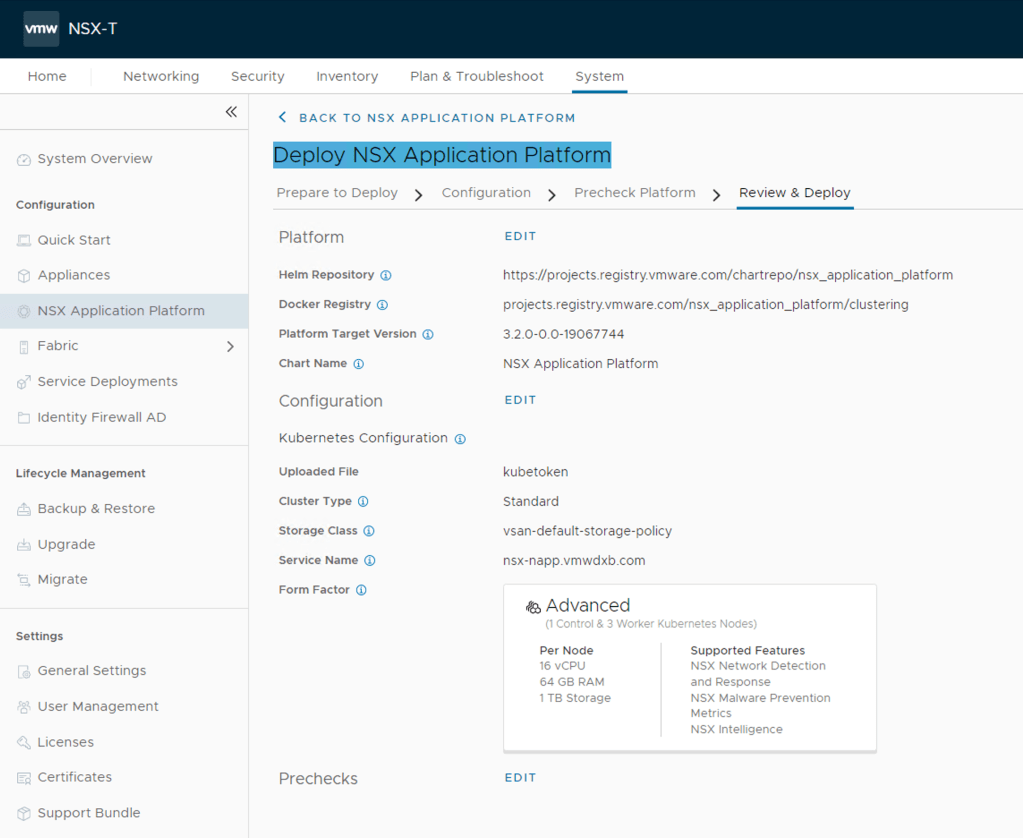
I am using NSX-T Version: 3.2.0.0.0.19067744

Overview of NSX Network Detection & Response

Sourced from VMware

The NSX Network Detection and Response maps and defends against MITRE ATT&ACK techniques. It provides a cloud-based architecture that enables detectors to gain comprehensive visibility into network traffic that crosses the network perimeter (north/south), and traffic that moves laterally inside the perimeter (east/west).

Main Objective

The main objective of the NSX Network Detection and Response feature is to collect key abnormal activity or malicious events from every event source that is activated in your NSX-T Data Center environment. The collected events that are determined to require further analysis are then submitted to the VMware NSX® Advanced Threat Prevention cloud service for correlation and visualization. You can view and manage the results using the NSX Network Detection and Response user interface (UI).

NSX Network Detection and Response correlates events that are determined to be related into campaigns. The threat events in a campaign are organized into a timeline that is available for a security analyst to view and triage using the NSX Network Detection and Response UI.

Event Types and Event Sources

The following table lists the event types that NSX Network Detection and Response can collect and the sources that generate those events. In order for any of the event source to send the events to NSX Network Detection and Response, you must activate the corresponding NSX feature mentioned for the event type.

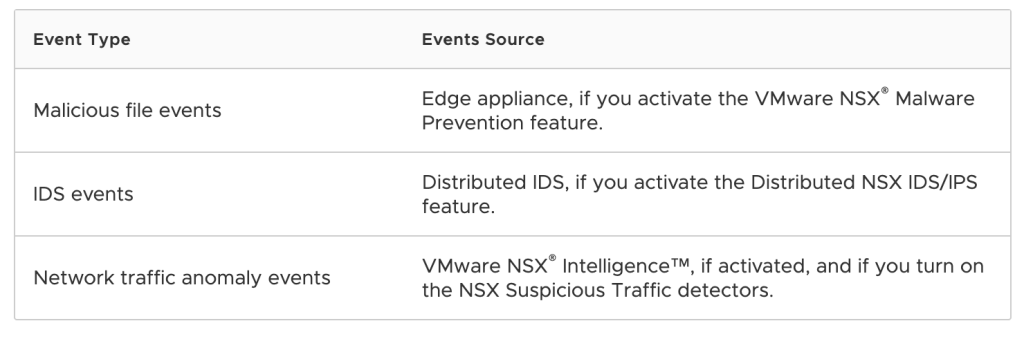
Important:To maximize the NSX Network Detection and Response feature, activate one or more of the NSX features whose events it consumes. Although you can activate the NSX Network Detection and Response feature on its own, if you do not activate any of the NSX features mentioned in the previous table, NSX Network Detection and Response does not have any events to analyze and, thus, cannot give any of the benefits it has to offer.

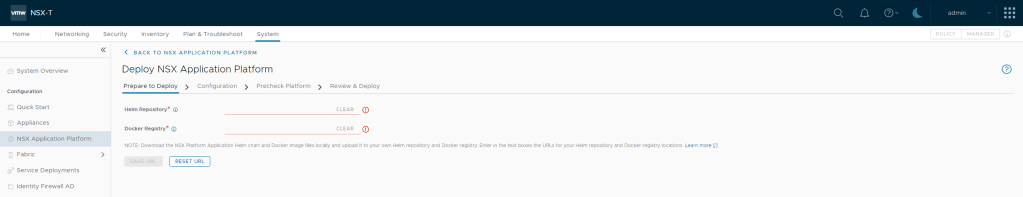
Activating and Using NSX Network Detection & Response

Before you can start using the NSX Network Detection and Response feature, the license and software requirements must be met and you will need activate the feature under NAPP. You must activate and configure the corresponding NSX features to start using NSX NDR to manage the different event types that you can monitor in your NSX-T Data Center environment.

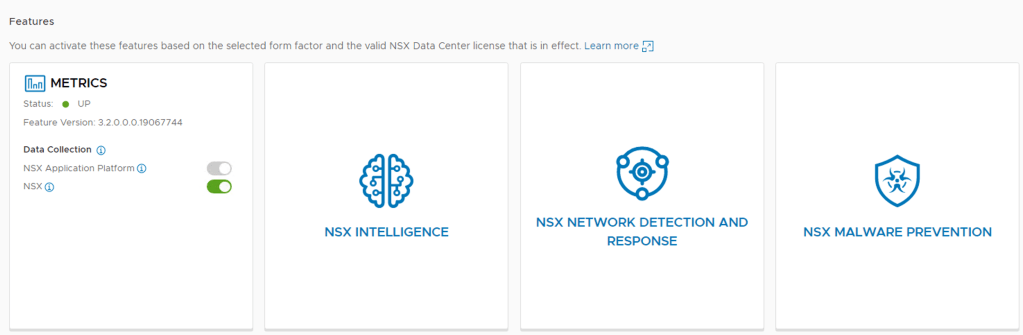
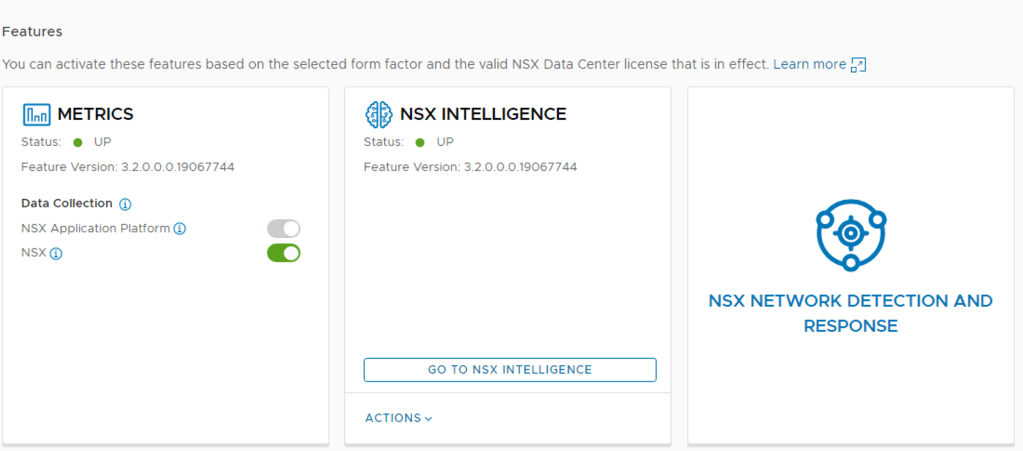
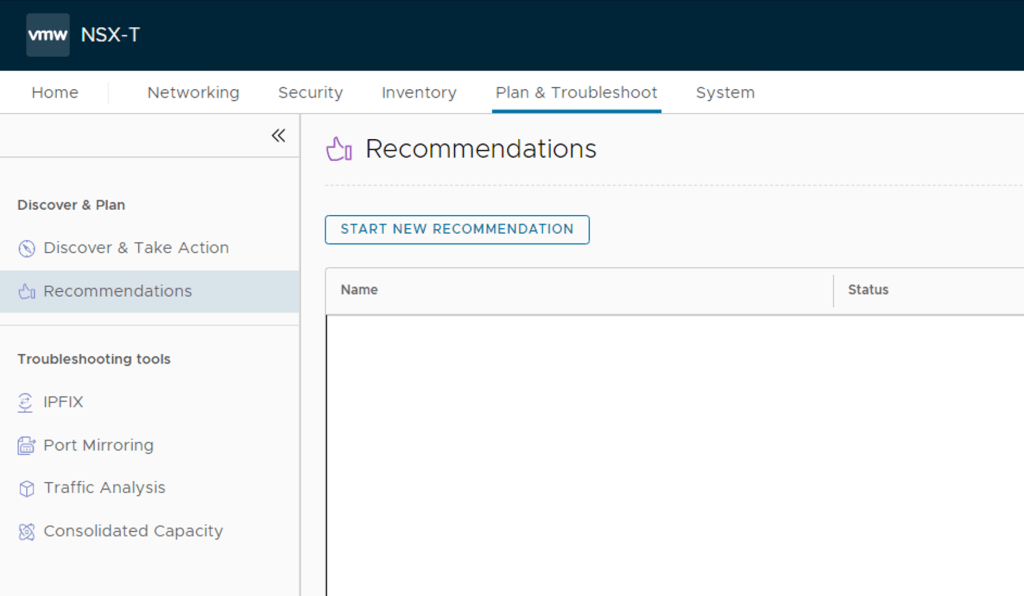
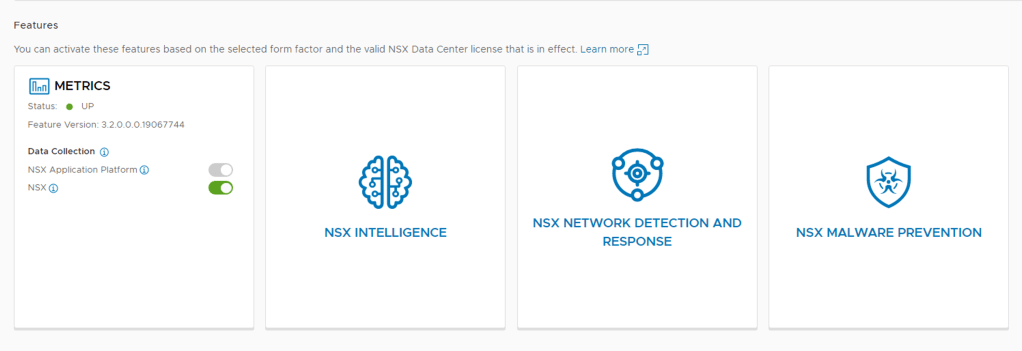
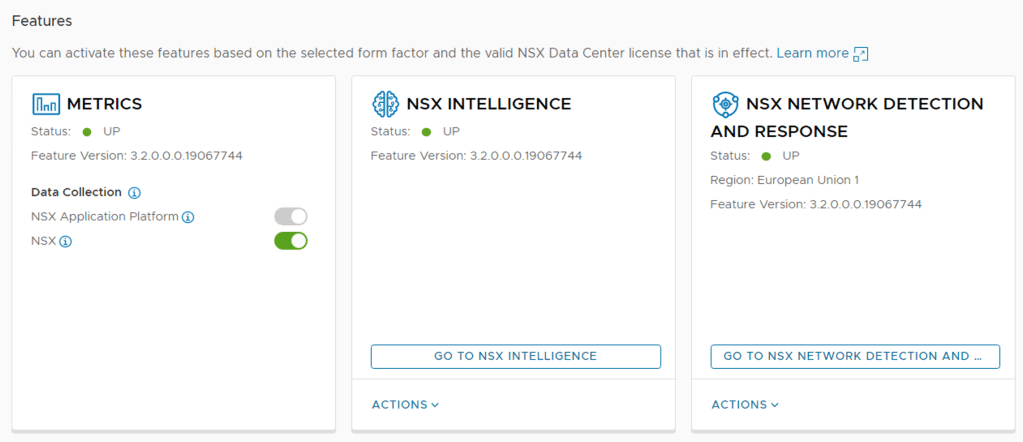
Step 1 – Under System -> NSX Application Platform select NSX NETWORK DETECTION AND RESPONSE.

Click NDR

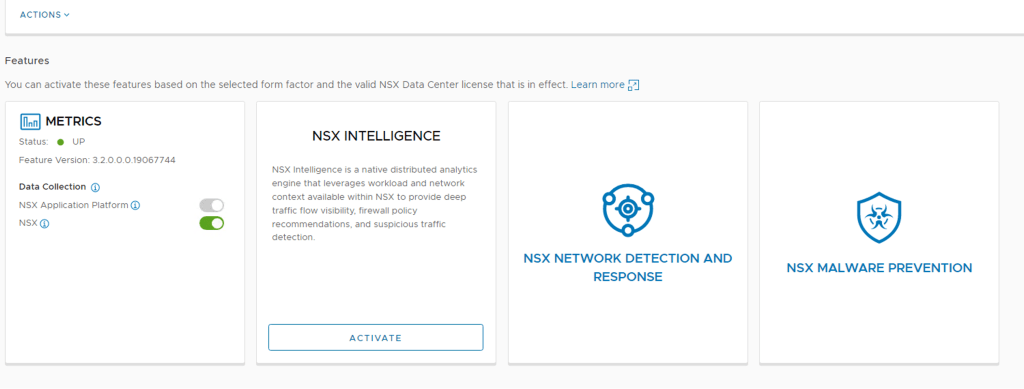
Step 2 – Once have your mouse over NSX NETWORK DETECTION AND RESPONSE you should see the Activate option, click this.

Step 3 – Next you will need to select one of the available cloud regions from which you can access the NSX Advanced Threat Prevention cloud service – This will depend on your license. I selected Europe below.

NOTE: The same Cloud Region selection is used in both the Malware Protection and the Network Detection and Response features.

NDR Activation

The system uses the NSX Advanced Threat Prevention cloud service to perform deeper analysis of detected threat events, perform event correlation and visualization, and fetch periodic updates on those detected threat events. If you previously activated the VMware NSX® Malware Prevention feature, the cloud region selected for that feature is preselected and is used for the NSX Network Detection and Response feature.

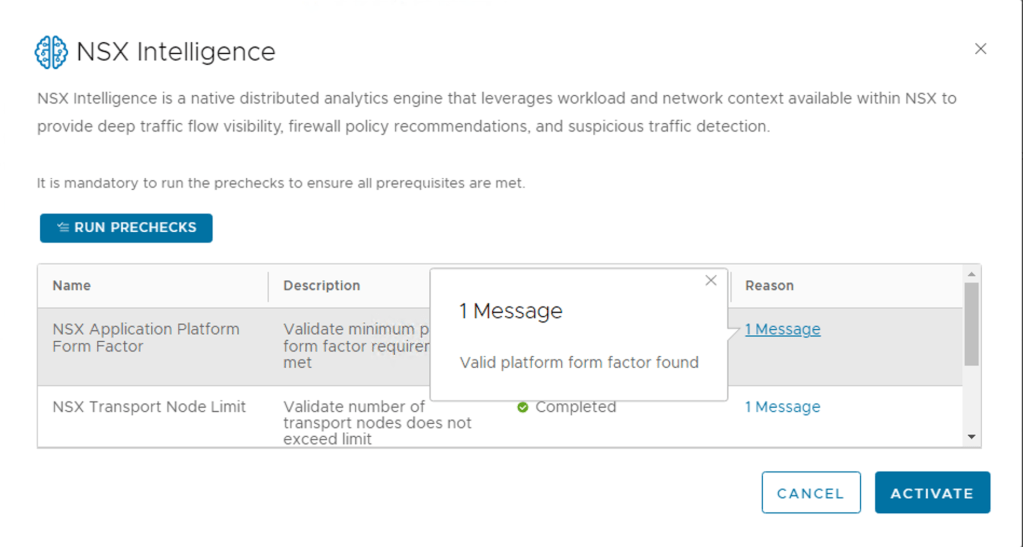
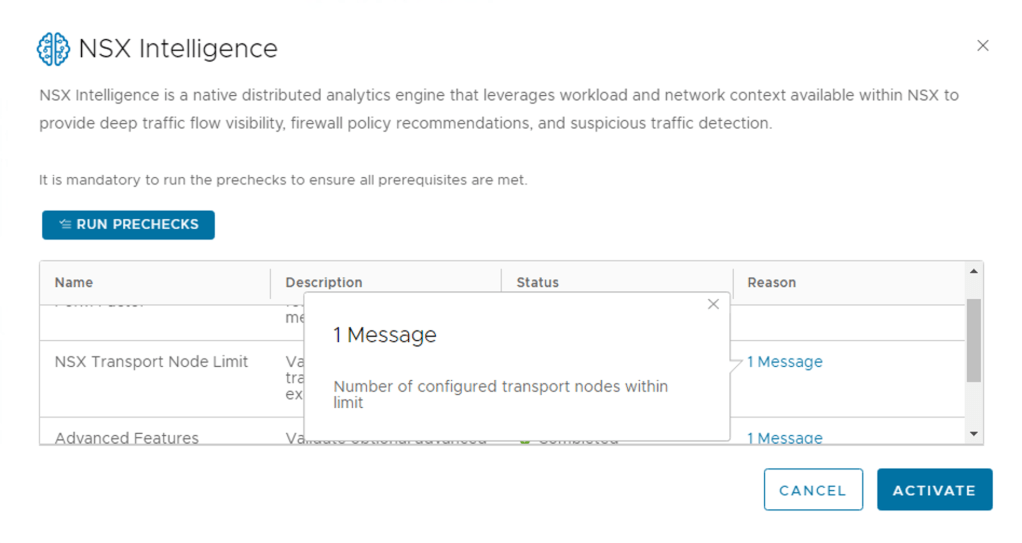
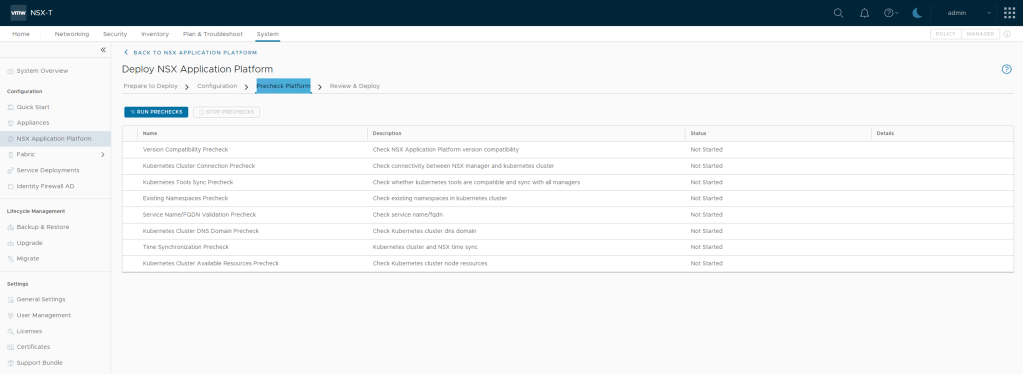
Step 4 – Now Click the RUN PRECHECKS

NOTE: It is mandatory to run the prechecks to ensure all prerequisites are met.

Run Pre Checks

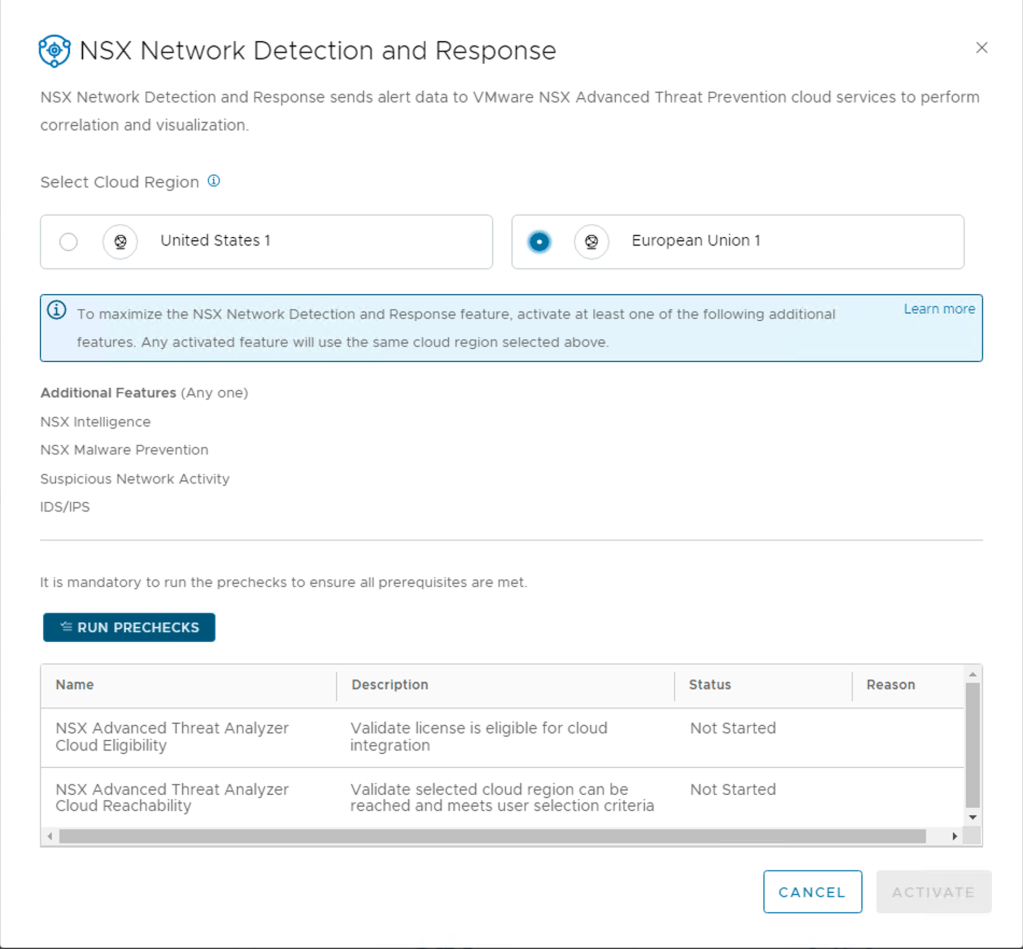
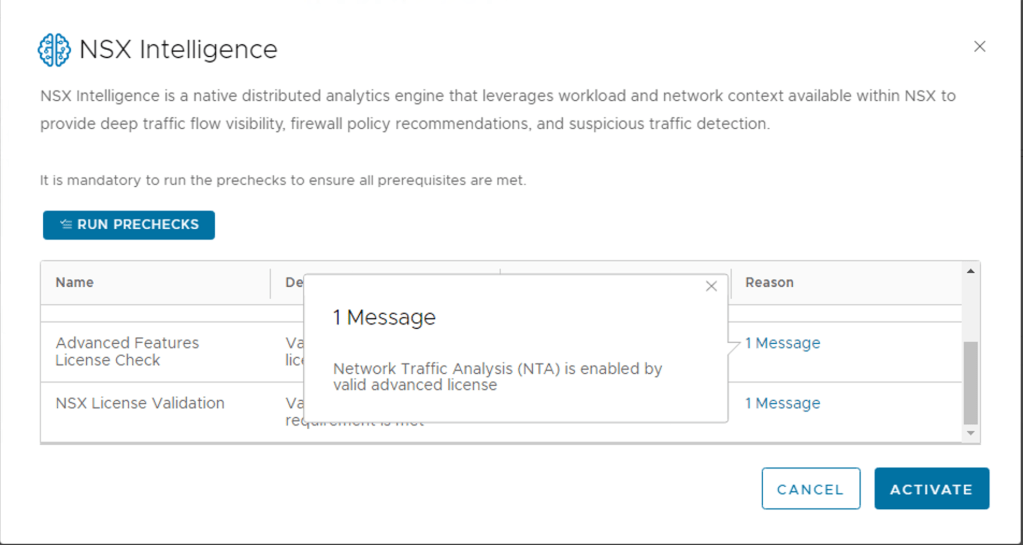
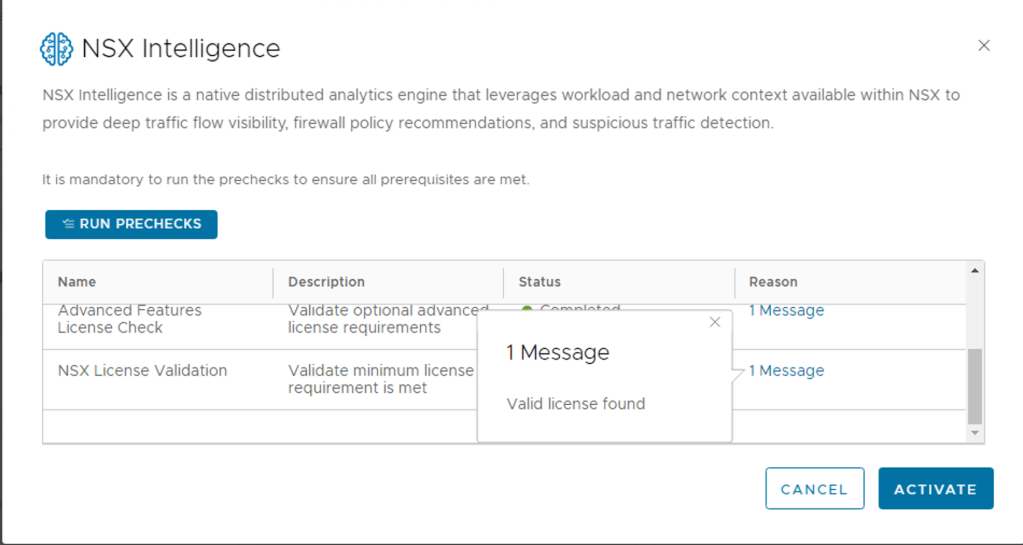
This precheck process can take some time as the activation wizard validates that the minimum license requirement is met. The wizard also performs the connectivity checks between the NSX Manager appliance and the NSX Advanced Threat Prevention cloud service. It also validates that the selected cloud region is reachable.

Pre Check Validating Licenses

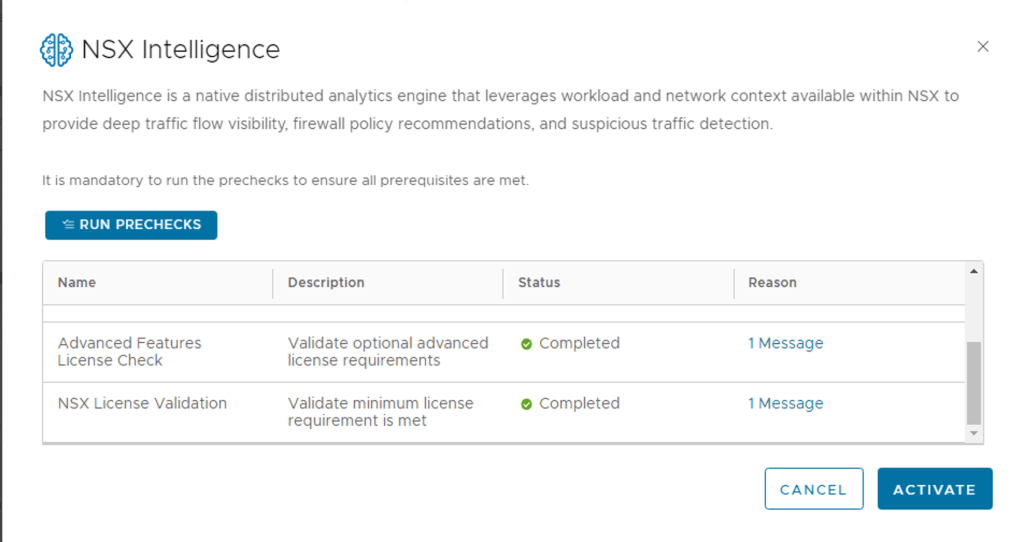
Step 5 – Last Step is to Activate, Click Activate if all the pre-checks where successful.

Active after Pre-Checks

After clicking activating NSX does the needful to get Network Detection and Response up and running. This may take some while it’s doing all the configurations.

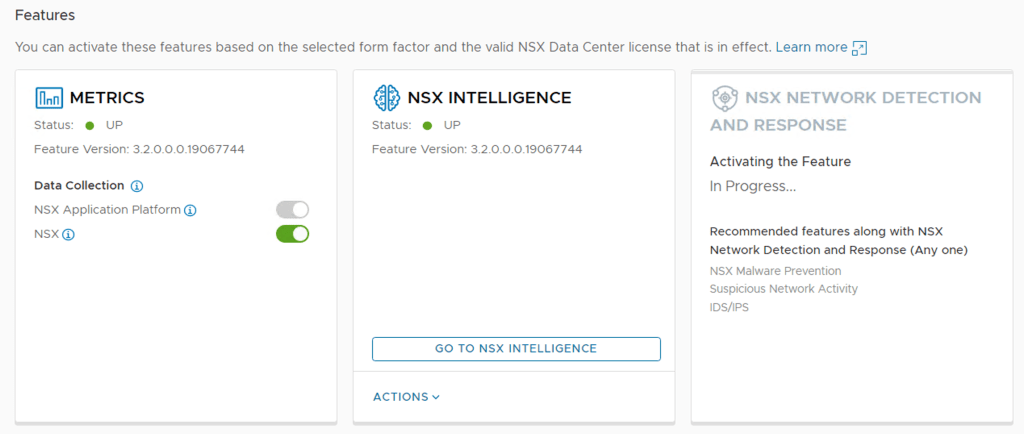
Once completed, the Status should be Green and shows UP

Step 6 – Once the status has turned green, you will want to logout off the NSX Manager and log back in, this will update the UI to include the NSX Network Detection and Response landing page.

You can check it before logging out too, click on the top right hand corner where the nine dots are (3×3). This is a new addition to the UI in 3.2 and from the screen shot below you notice that my NSX Manager has been integrated with the NSX Advanced Load Balancer but you do not see NSX Network Detection and Response here.

Before Logging out

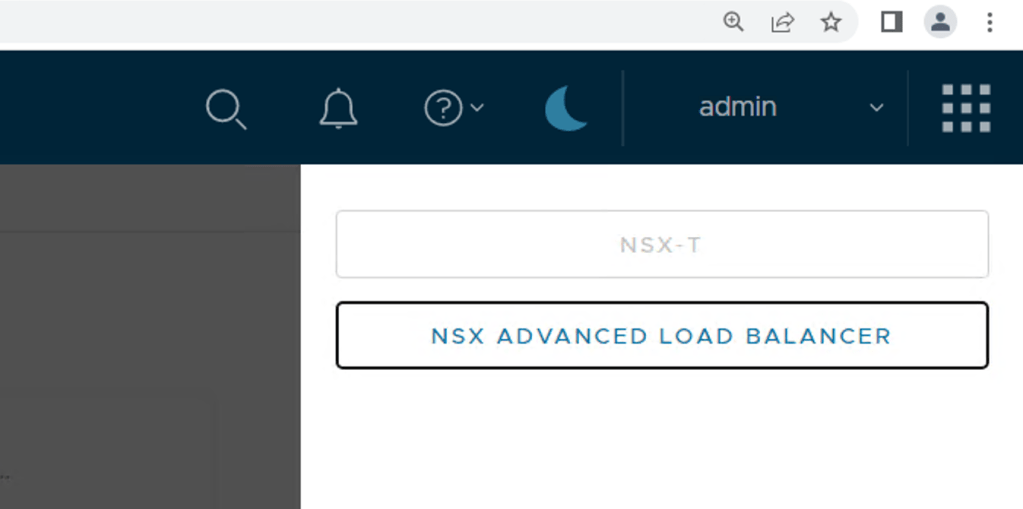
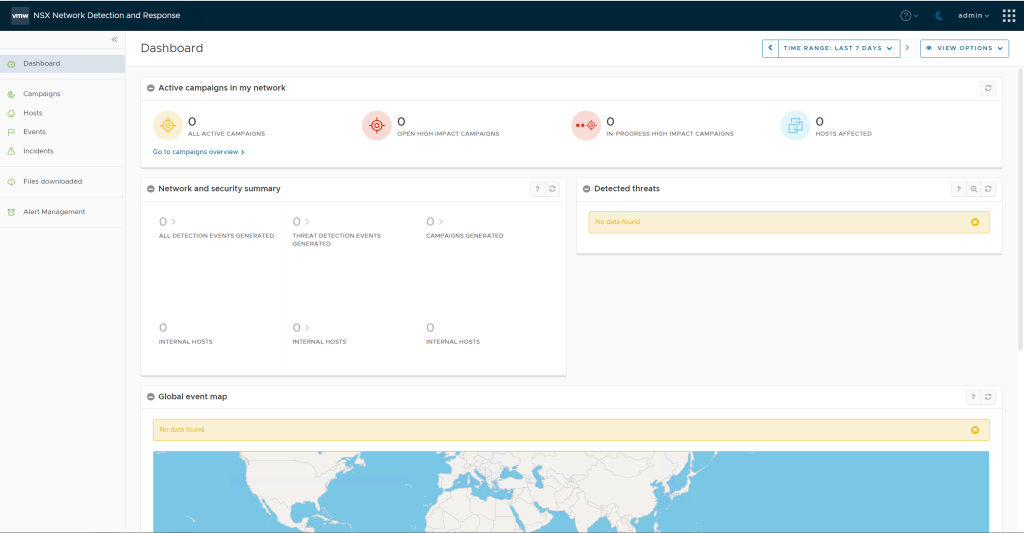
Step 7 – I logged out and logged back into my NSX Manager as admin, clicked on those same nine dots again and there you find the button to click to launch the NSX Network Detection and Response land. It will open a new window once you have clicked it.

After logging back in as Admin

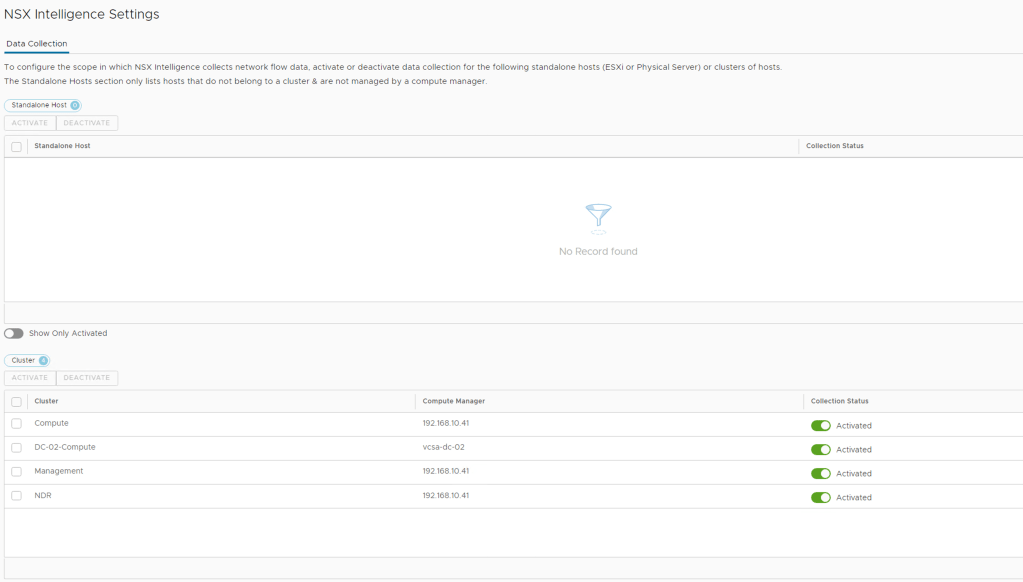
At this stage my page is still empty since I have not enabled any of the additional features, I will do these in follow-up blogs posts and you will be able to see how all my security events from NSX Intelligence, NSX Malware Prevention, Suspicious Network Activity and IDS/IPS are all correlated here.

NSX Network Detection and Response Page

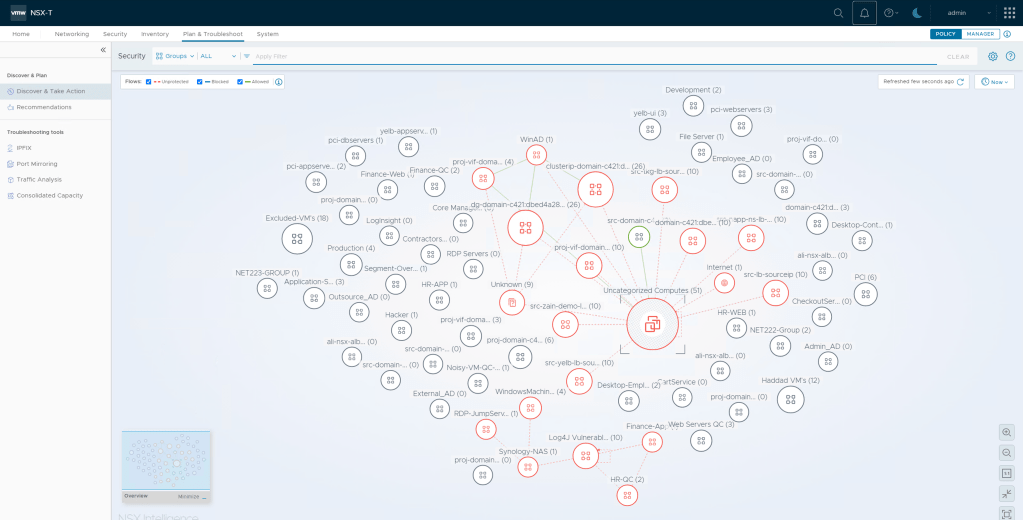
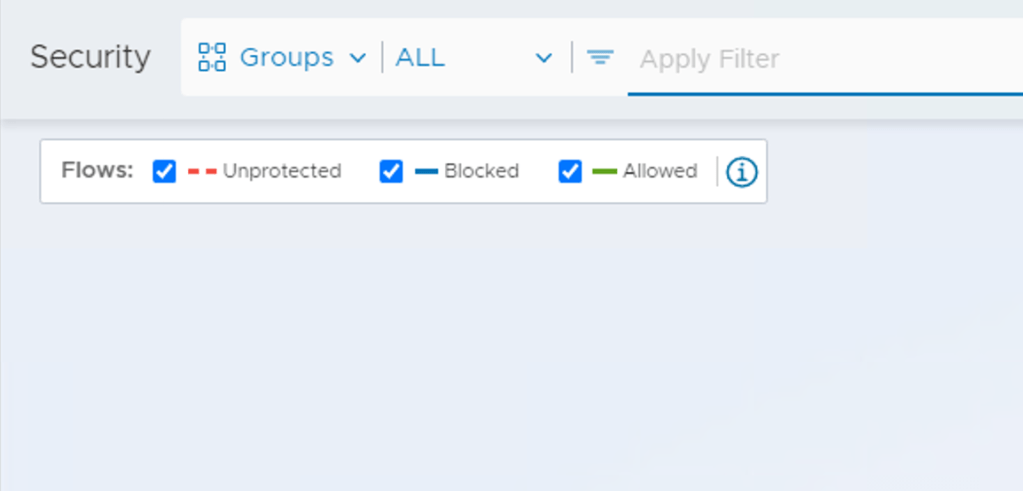
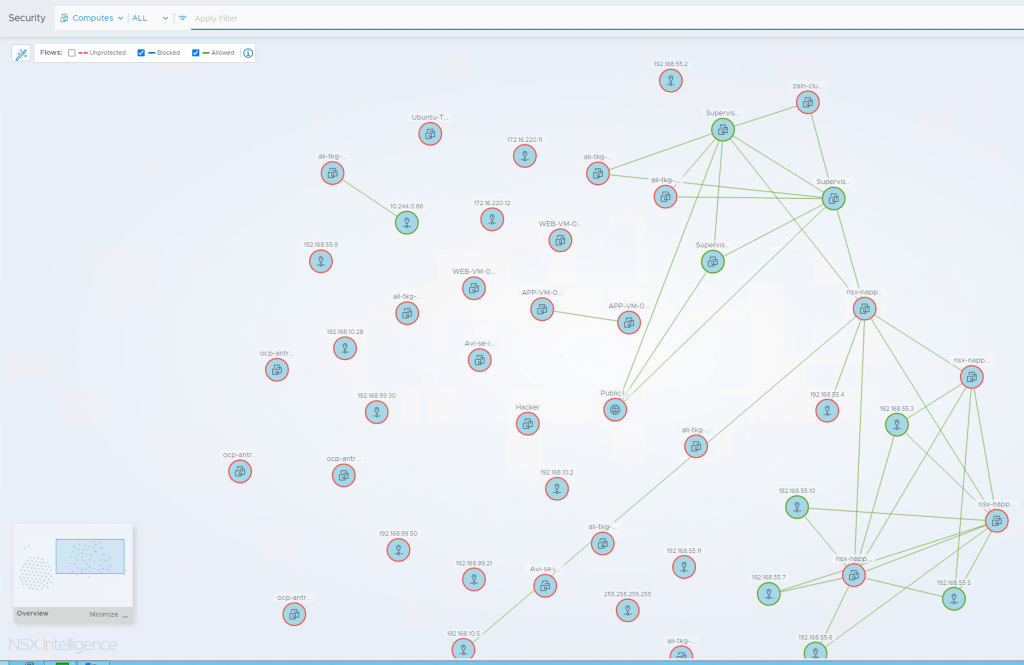
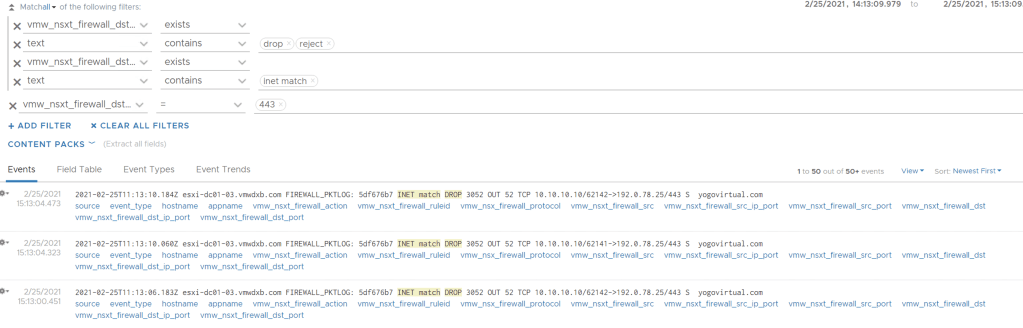
Step 8 – Go back to the NSX Manager and go to the Security Overview page and should now see the dashboard showing with highlights of various security related activities. In future posts we will some traffic populating here.

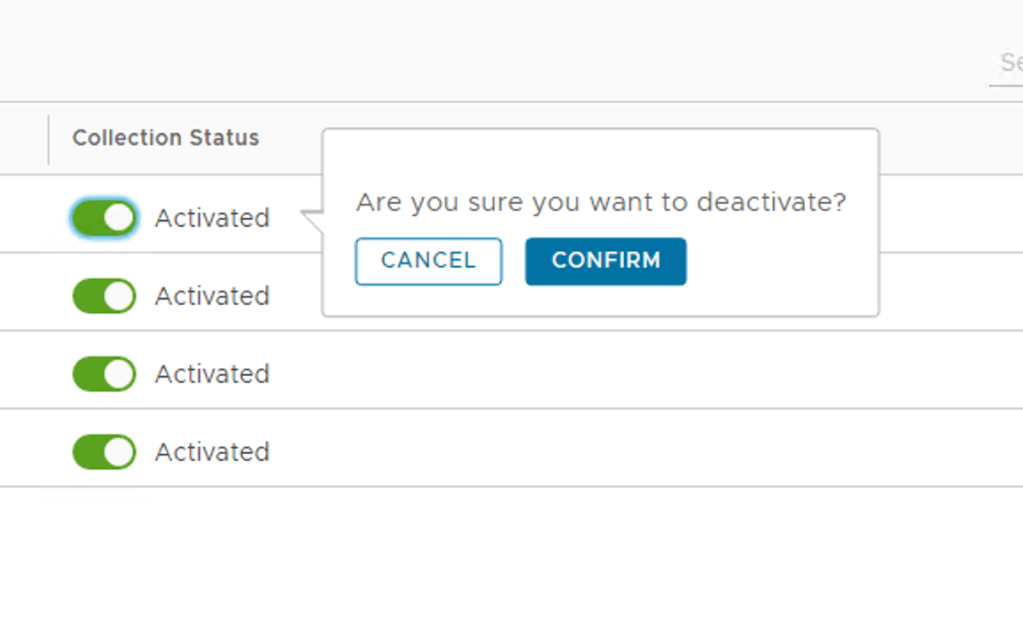
A quick win would be turning on NSX Suspicious Traffic detectors.

Note: In NSX-T 3.2.0.1 you want to avoid enabling these two detectors as there is a software bug that will meltdown your NSX Intelligence environment, so best not to enable Horizontal Port Scan and Uncommonly Used Port. I would advise checking the release notes to see when this bug has been fixed.

***Update February 2023 – The concern raised above has been fixed in NSX 3.2.1 and 4.0.X, the impact of enabling these two detectors is limited to your NAPP/NSX-Intelligence environment and not your complete network***

Summary

Activating NSX Network Detection and Response is fairly straightforward, but the true value comes in once you have enabled all features which feed data into the solution.

So make sure to get these additional features enabled to take full advantage of the NSX NDR solution:

VMware NSX Intelligence 3.2 Deployment

This post focuses on NSX Intelligence 3.2 when deployed on the NSX Application Platform in NSX-T 3.2. It does not cover migrating from previous versions of NSX Intelligence 1.X to 3.2 but instead looks at a greenfield installation.

NSX-T 3.2 introduced us to the NSX Application Platform (NAPP) and this replaces the need to deploy NSX Intelligence as a standalone appliance and simply enable the capability in the UI after deploying the NAPP platform.

NSX Intelligence 3.2 is available for ESXi-based hosts, physical server hosts, and ESX clusters that are enabled by the VMware vSphere® Lifecycle Manager.

The NSX Intelligence feature aggregates the network traffic flows in your NSX-T environment to provide deep traffic flow visibility, firewall policy recommendations, and suspicious traffic detection. To allow for scale-out capability, this feature is now hosted on the NSX Application Platform beginning with NSX Intelligence 3.2.

Features available in NAPP

For a production environment, this feature requires that you select the Advanced form factor during the NSX Application Platform deployment.

NOTE: NSX Intelligence activation requires the NSX Enterprise Plus license or one of the NSX Distributed Firewall licenses.

Activating VMware NSX Intelligence

Step 1 – In the NSX-T UI browse to System -> NSX Application Platform

Step 2 – Next, Select NSX Intelligence and click Activate

Activating NSX Intelligence

Step 3 – Run the PRECHECKS. This take a minute or so depending on your environment

Platform Form Factor Check
NSX Transport Node Limit
NTA enabled license validation

One of the new features introduced with NSX Intelligence is Network Traffic Analysis, I will be posting some details and examples of enabling this feature in the future.

License Check

Step 4 – Once all pre checks are cleared, click activate

Proceed to Activate

Once you selected Activate, you can monitor the process. This will take some time to complete.

NSX Intelligence Progress deployment

NSX Intelligence Activation Completed

Step 6 – Click on “Go To NSX Intelligence”

Step 7 – Click Refresh to View – you will start seeing your workloads and some flows

NSX Intelligence View

Step 7 – By default, after NSX Intelligence is activated, it starts collecting network traffic data on all standalone hosts and cluster of hosts in your NSX-T environment. You can optionally configure NSX Intelligence to deactivate traffic data collection for one or more standalone hosts or clusters of hosts.

Some default settings can adjusted by clicking on the gear icon on the top right

NSX Intelligence Related Settings

Out the box NSX Intelligence was enabled on all the vSphere cluster exposed to the NSX Manager, you can change the default selection using the toggle on collection status

System -> NSX Intelligence

NSX Intelligence Settings
Toggle this button to stop NSX Intelligence for a specific vSphere Cluster

After removing the clusters that I did not want NSX Intelligence enabled this is my final view

Using NSX Intelligence

To start viewing the graphical visualization of your NSX-T workloads, navigate to Plan & Troubleshoot > Discover & Take Action and refresh the web browser you are using for the NSX Manager session

NSX Intelligence View

You can now change some of the default filters and how NSX Intelligence displays, selecting Groups or remove the tick box from specific flows.

Filter Optoins

Some Sample Filter Outputs

Filtered to all Computers instead of Security Groups and removed all unprotected flows

Using NSX Intelligence Policy Recommendation

NSX Intelligence can be used to provide policy recommendation and push these recommendation to the NSX Distributed Firewall for policy enforcement.

Step 1 – Click Plan & Troubleshoot -> Recommendations

Recommendations

Step 2 – Click -> Start New Recommendation

Default Settings

Step 3 – Recommendation Name: Provide a name for the recommendation – see the note below.

Note: This will be used as a suffix when naming new recommended groups and rules

Step 4 – Description: Provide a description as needed

Step 5 – Selected Entities in Scope: Selected the Security Groups or VM’s you want policy recommendations for.

Select Entities

I selected security groups related to a specific application and used the toggle at the bottom of the page to show only selected fields

Step 6 – Time Range: The traffic data captured during this time range is used to create the NSX Intelligence recommendation. Default is set to 1 Month, but you can change this.

Step 7 – Advanced Options

There are some options which can be adjusted to improve the output of the recommended policies.

First Advanced Option – Connectivity Strategy, Create Rules For

First Advanced Option – Connectivity Strategy, Create Rules For

Select the traffic flows to consider in the recommendation analysis.

  1. All Traffic – Consider all traffic types: outbound, inbound, and intra-application
  2. Incoming and Outgoing – Considers traffic flows that originate from inside the application boundary to outside, and from outside the application boundary to inside of the boundary
  3. Incoming Traffic – Only consider traffic flows that originate outside of your application boundadry
  4. Incoming and Intra-application Traffic – Consider traffic flows that originate from outside of your application boundary and intra-application traffic

Second Advanced Option – Default Rule

Second Advanced Option – Default Rule

Select a connectivity strategy to use to create the default rule for the security policy. An appropriate action is set on the rule based on the value of the connectivity strategy.

ALLOWLIST – Creates a default drop rule.
DENYLIST – Creates a default allow rule.
NONE – No default rule is created.

Third Advanced Option – Recommendation Output

Select between Compute Based or IP Based

Third Advanced Option – Recommendation Output

NSX Intelligence recommendations include Distributed Firewall (DFW) policies that consist of IPSet objects with a static list of IP addresses or groups that consist of constituent VMs, physical servers, or both.

Fourth Advanced Option – Recommendation Service Type

Select L4 Services or L7 Content Profiles

Fourth Advanced Option – Recommendation Service Type

NSX Intelligence recommendations include Distributed Firewall (DFW) policies that consist of L4 services comprising of respective Port and Protocol or L7 Context Profiles.

Firth and Final advanced option – Group Reuse Threshold

This option allows for reusing security groups for common workloads with common network flows.

A threshold percentage between 10 and 100 which specifies how strictly groups are reused to cover the unmicrosegmented flows seen. Use this to control whether existing groups should be reused or new groups created when creating/modifying rules in a security policy.

Setting this value to 100 means that the members of the picked group have to be a subset of unmatched computes, which means 100% of group members match. This will result in creating more new groups however as existing groups are less likely to be reused in rules being added/modified.

Setting this to lower values like 10 or 20 means that even groups with extraneous members other than the computes we are seeking to group will be picked as additional rule sources or destinations. This will result in aggressive group reuse and hence less number of new groups to be recommended. However this also means that the rule src/dest is being expanded beyond the flows we have seen due to the extraneous members.

Final Step – Start Discovery

Click Start Discovery

Discovery Started

Once the recommendation process has started, the output can be monitored under recommendations

Once the recommendation has completed. Click on the grey arrow next to three dots and expand the output.

Completed Recommendation

Click on the three blue dots and select Review & Publish to see the discovery and recommendations.

You can browse through the rules recommended and check the process rules. Group names can be edited, services added or removed.

Edit group names

If all the recommended policies are acceptable or you have completed editing them you can click on Proceed

Finale Review before Publishing

Place the newly recommended policies above or below the existing Firewall rule sections by clicking on the Actions ‘’ icon. Alternatively, drag and drop the highlighted recommended policies to sequence it within the existing Firewall rule sections.

Once the placement of the recommended policy is done, click Publish and Yes

You can now view the published rules in the Distributed Firewall Table – click on View in Distribute Firewall Table

View Option

You can expand the recommended policy section to view all the rules which have been published to NSX Distributed Firewall

Recommended Policies got published to the Distributed Firewall

One last bit I would highly recommend is enable logging for these rules as needed, by default Logging on the rules are disabled. Click on the 3 blue dots by the Policy name and you will see the option to enable logging for all the rules in this Policy Section.

Enable Logging on all rules in the policy section

Once you have changed this, don’t forget to Publish the changes on the Top Right

Publish Firewall Rule Changes

To delete the entire recommended policy just select the Policy name and click Delete and above and then Publish the changes to the Distributed Firewall. Take note that this only removes the Firewall Policies but the Security Groups which got created and the membership to these groups is still maintained and needs to be manually removed.

The recommendation can be deleted from the UI, Plan & Troubleshoot -> Recommendations. Click on the 3 Blue dots and select delete.

Note: The Delete action only removes the item from the displayed list. To delete a published rule, go to the Security -> Distributed Firewall page.

Conclusion

I hope that this is helpful to someone trying to deploy and use NSX Intelligence 3.2. I will do some follow up posts looking at the Suspicious Traffic capabilities which also made possible with NSX Intelligence.

VMware NSX Application Platform Deployment

This post is intended for administrators who must deploy or manage the NSX Application Platform and activate the NSX applications that are hosted on the platform. This post will cover the deployment and activation starting from the NSX-T UI and it assumes the needed Kubernetes platform has already been prepared (Controller and Worker Nodes already created to meet the requirements as documented by VMware)

Overview

The NSX Application Platform is a modern microservices platform that hosts the following NSX features that collect, ingest, and correlate network traffic data in your NSX-T environment.

  • VMware NSX® Intelligence™
  • VMware NSX® Network Detection and Response™
  • VMware NSX® Malware Prevention
  • VMware NSX® Metrics

As network traffic data is produced, captured, and analyzed, the NSX Application Platform provides the platform that can be scaled out to meet the needs of these data-intensive features and the core services that support them.

Following is a list of some of the core services utilized by these NSX features. These services can be scaled out as the need arises.

  • Messaging
  • Analytics
  • Data Storage
  • Metrics

The NSX Application Platform is available beginning with NSX-T Data Center 3.2. After you meet the minimum system prerequisites and prepare for any existing analytics data that you want migrated from previous NSX Intelligence installation, you can deploy the platform using the NSX Manager user interface.

Refer to the below posts on the VMware documentation covering deployment prereq, licensing requirements and system requirements. I am assuming you have all these covered before trying to activate and deploy the NSX Application Platform from the NSX-T UI in this post.

NSX Application Platform Deployment Prerequisites
To install the NSX Application Platform successfully and to activate the NSX features that it hosts, you must prepare the deployment environment so that it meets the minimum required resources.[Read more]

License Requirement for NSX Application Platform Deployment
To deploy the NSX Application Platform, your NSX Manager session must be using a valid license during the NSX Application Platform deployment.[Read more]

NSX Application Platform System Requirements
The following table lists the form factors that the NSX Application Platform supports, along with the minimum resources required for each. The form factor you select determines which NSX features you can activate or install on the platform.[Read more]

NSX Application Platform Deployment Checklist

Use the checklist to track your progress with the NSX Application Platform deployment workflow and the activation of the NSX features that the platform hosts

Deploying the NSX Application Platform

My deployment leverages a Tanzu Kubernetes Cluster and the NSX-T native Load Balancer and all these have already been enabled and deployed prior to starting this deployment.

Let’s get started by clicking on System -> NSX Application Platform

Step 1 – Prepare to Deploy

Start off by clicking “Deploy NSX Application Platform

Prepare to Deploy

Helm Repository – The repository from which you can obtain the packaged Helm chart for NSX Application Platform.

https://projects.registry.vmware.com/chartrepo/nsx_application_platform

Docker Registry – The registry URL from which you can obtain he Docker images for NSX Application Platform. Take note, there is not https:// in this URL

projects.registry.vmware.com/nsx_application_platform/clustering

These packages can be hosted on a private container registry or you can point to the VMware public repository – I am keeping it simple and pointing my deployment to the VMware public repository. This would mean your NSX-T Manager has Internet reachability.

If you are using a VMware Tanzu Kubernetes Cluster (TKC), do not use its embedded Harbor container registry for hosting the NSX Application Platform Helm charts and Docker images. Your infrastructure administrator must set up a separate Harbor container registry.

URL Populated

After populating the URLs, click SAVE URL.

If your NSX-T manager can reach these URLs it will list the Platform Target version and Chart Name shown below.

Platform Target Version

Click NEXT on the bottom right hand corner

Step 2 – Configuration details

Configuration

Kubernetes Configuration – Upload File

You need to create a kubeconfige file – all the steps are nicely documented here.

Select and browse to the file on your local machine and upload it to the NSX-T Manager

Sample out of my Token File

If you see the error message Server version and client version are incompatible, upload the latest Kubernetes Tools version to resolve the error, upload a compatible version of the Kubernetes tools bundle.

You can use the Kubernetes Tools bundle provided in the VMware Product Download site at https://customerconnect.vmware.com/downloads/details?downloadGroup=NSX-T-3201&productId=982&rPId=84354#product_downloads. When you download the file, the default name is kubernetes-tools-buildversion.tar.gz. For example, kubernetes-tools-1.20.11-00_3.5.4-1.tar.gz. Do not rename the file when you download it. The file is signed with a VMware private key.

  1. Either select Upload Local File or Upload Remote File.
  2. If you selected Upload Local File, click Select and navigate to the location of the Kubernetes Tools file.
  3. If you selected Upload Remote File, enter the URL from which the system can obtain the compatible Kubernetes Tools file. For example, enter the URL of the kubernetes-tools-buildversion.tar.gz file that you downloaded.
  4. Click Upload.

Storage Class – Storage Class values are provided by the kubeconfig file. To change available choices, please modify and resubmit the kubeconfig file.

Cluster Type – Standard is the only supported option today

Service Name – Enter a valid fully qualified domain name (FQDN) value for the Service Name text box.

The Service Name is used as the HTTPS endpoint to connect to the NSX Application Platform. The Service selector defines an abstract reference to multiple Kubernetes nodes. To change the available choices, please modify and resubmit the kubeconfig file.

This requires a FQDN created in DNS and reachable by the NSX-T Manager. This IP will be configured as ingress on the load balancer.

Form Factor – Lastly on this page you need to select the form factor which will be deployed. If you are planning to enable all the features hosted on the NAPP platform you will need to select the advanced form factor.

Standard Supports – NSX Network Detection and Response, NSX Malware Prevention and Metrics.

Advanced Supports – NSX Network Detection and Response, NSX Malware Prevention and Metrics and NSX Intelligence.

Configuration parameters populated

Once all the parameters are populated, click Next on the bottom right.

Step 3 – Pre Check the Platform

The system needs to check the configuration information that have been obtained before proceeding with the NSX Application Platform deployment.

Pre Checks

Click on Run PreChecks, the system will run the listed pre checks and should take a minute or so

Pre Checks Completed

All pre checks completed successfully with one warning “Kubernetes cluster and NSX time should be in sync.” This is just a note and not an error.

If you the system highlighted any other others you can view the details of these and address them as needed else Proceed and click Next on the bottom right.

Step 4 – Deploy NSX Application Platform

Deploy NSX Application Platform

Review all the settings shown and if all the settings look correct proceed to Deploy the solution by clicking deploy at the bottom right.

Deployment Progress Monitor

This will take some time depending on your environment but as the deployment is taking place, you can see the progress meter moving. I have come across a number of deployments hang at this point:

Installing Certificate Manager… In Progress 10%

At this stage I have not managed to figure out the main cause for this but instead I landed up recreating everything and it worked. If I do find any updated information on troubleshooting this I will share it here.

40% Done
Registering Platform – 70% Done
Installing Metrics – 80% Done

Results

Once the system successfully deployed the NSX Application Platform, the UI is updated with the details about the platform.

Successful Deployment
Core Services View

Once the NSX Application Platform has successfully deployed you can now continue with enabling the features listed at the bottom of the page – NSX Metrics is enabled with the deployment.

Features running on NAPP

I will be doing follow-up posts enabling and consuming the various features.

Tanzu Deployment Screenshot for reference

Just some screen shots of my Tanzu deployment in vCenter

My Namespace -napp-ns
Kubernetes Events
General
Workload Networking

VMware NSX-T Data Center 3.2.0.x

VMware NSX-T Data Center 3.2.0   |  16 December 2021  |  Build 19067070

***VMware removed 3.2.0 around a week or two after the release and recommend users upgrade to 3.2.0.1 instead***

NSX Application Platform

What’s New

NSX-T Data Center 3.2.0 is a major release offering many new features in all the verticals of NSX-T: networking, security, services and onboarding. Here are some of the major enhancements.

  • Switch agnostic distributed security: Ability to extend micro-segmentation to workloads deployed on vSphere networks.
  • Gateway Security: Enhanced L7 App IDs, Malware Detection and Sandboxing, URL filtering, User-ID firewall, TLS inspection (Tech Preview) and Intrusion Detection and Prevention Service (IDS/IPS).
  • Enhanced Distributed Security: Malware detection and Prevention, Behavioral IDS/IPS, enhanced application identities for L7 firewall.
  • Improved integration with NSX Advanced Load Balancer (formerly Avi): Install and configure NSX ALB (Avi) from NSX-T UI; Migrate NSX for vSphere LB to NSX ALB (Avi).
  • NSX for vSphere to NSX-T Migration: Major enhancements to the Migration Coordinator to extend coverage of supported NSX for vSphere topologies and provide flexibility on the target NSX-T topologies.
  • Improved protection against Log4j vulnerability: Updated Apache Log4j to version 2.16 to resolve CVE-2021-44228 and CVE-2021-45046. For more information on these vulnerabilities and their impact on VMware products, please see VMSA-2021-0028.

VMware introduces new capabilities on the Gateway and with this a new licensing model has been introduced focusing on Security capabilities

  • VMware NSX Gateway
  • VMware NSX Advanced Threat Prevention Add-on to NSX Gateway Firewall

Refer to Product Offerings for NSX-T 3.2 Security for all the features included in these new licenses.

My Highlights
  • The introduction of Advanced Threat Prevention capabilities with Malware Detection and Prevention and Network Detection and Response fully integrated into the NSX-T UI. This brings Sandboxing capabilities native to the platform.
  • Now customers can leverage their native VDS switch to take advantage of all these distributed security capabilities without having to recreate segments via the NSX-T UI and migrate workloads between port groups.
  • NSX-T 3.2 introduces the NSX Application platform which replaces the traditional NSX-T Intelligence appliance. VMware NSX Application Platform is a new container based solution introduced in NSX-T 3.2.0 that provides a highly available, resilient, scale out architecture to deliver a set of core platform services which enables several new NSX features.
  • Some of the new features are currently made available as Tech Preview – Gateway Intrusion Detection/Prevention and TLS decryption/encryption
Gateway Firewall
  • User Identity-based Access Control – Gateway Firewall introduces the following additional User Identity Firewall capabilities:For deployments where Active Directory is used as the user authentication system, NSX leverages Active Directory logs.
  • For all other authentication systems, NSX can now leverage vRealize Log Insight based logs to identify User Identity to IP address mapping.
  • Enhanced set of L7 AppIDs – Gateway Firewall capabilities are enhanced to identify a more comprehensive number of Layer-7 applications.
  • TLS Inspection for both inbound and outbound traffic (🔎Tech Preview; not for production deployments) – More and more traffic is getting encrypted on the network. With the TLS inspection feature, you can now leverage NSX Gateway Firewall to do deep-packet inspection and threat detection and prevention services for encrypted traffic as well.
  • URL Filtering (includes categorization and reputation of URLs) – You can now control internet bound traffic based on the new URL Filtering feature. This feature allows you to control internet access based on the URL categories and as well as the reputation of the URLs. URL repository, including the categorization and reputation data, is updated on an ongoing basis for updated protection.
  • Malware Analysis and Sandboxing support – NSX Gateway Firewall now provides malware detection from known as well as zero-day malware using advanced machine learning techniques and sandboxing capabilities. The known malware data is updated on an ongoing basis. (Please see known issue 2888658 before deploying in live production deployments.)
  • Intrusion Detection and Prevention (🔎Tech Preview; not for production deployments) – For NSX Gateway Firewall, Intrusion Detection and Prevention capabilities (IPS) are introduced in a “Tech Preview” mode. You can try the feature set in non-production deployments.
New NSX Application Platform
  • NSX Application Platform – VMware NSX Application Platform is a new container based solution introduced in NSX-T 3.2.0 that provides a highly available, resilient, scale out architecture to deliver a set of core platform services which enables several new NSX features such as:
    • NSX Intelligence
    • NSX Metrics
    • NSX Network Detection and Response
    • NSX Malware Prevention

The NSX Application Platform deployment process is fully orchestrated through the NSX UI and requires a supported Kubernetes environment. Refer to the Deploying and Managing the VMware NSX Application Platform guide for more information on the infrastructure prerequisites and requirements for installation.

Network Detection and Response
  • VMware Network Detection and Response correlates IDPS, Malware and Anomaly events into intrusion campaigns that help identify threats and malicious activities on the network.
  • Correlation into threat campaigns rather than events, which allows SOC operators to focus on triaging only a small set of actionable threats.
  • Network Detection and Response collects IDPS events from Distributed IDPS, Malware events (malicious files only) from Gateway, and Network Anomaly events from NSX Intelligence.Gateway IDPS (Tech Preview) events are not collected by NSX Network Detection and Response in NSX-T 3.2.
  • Network Detection and Response functionality runs in the cloud and is available in two cloud regions: US and EU.
Licensing
  • License Enforcement – NSX-T now ensures that users are license-compliant by restricting access to features based on license edition. New users are able to access only those features that are available in the edition that they have purchased. Existing users who have used features that are not in their license edition are restricted to only viewing the objects; create and edit will be disallowed.
  • New Licenses – Added support for new VMware NSX Gateway Firewall and continues to support NSX Data Center licenses (Standard, Professional, Advanced, Enterprise Plus, Remote Office Branch Office) introduced in June 2018, and previous VMware NSX for vSphere license keys. See VMware knowledge base article 52462 for more information about NSX licenses.
Tech Preview Features

NSX-T Data Center 3.2 offers several features for your technical preview. Technical preview features are not supported by VMware for production use. They are not fully tested and some functionality might not work as expected. However, these previews help VMware improve current NSX-T functionality and develop future enhancements.

For details about these technical preview features, see the available documentation provided in the NSX-T Data Center 3.2 Administration Guide. Links are provided in the following list that briefly describes these technical preview features. The topics will have Technical Preview in their titles.

Summary

So many new capabilities in NSX-T 3.2.0 will definitely be keeping me busy with future blogs posts which will hopefully help other get some of these features enabled.

VMware NSX Security

It has been a while since I last posted something here and so many new features have been added to VMware NSX since the 3.2 release in December 2021. With a major focus on Security in this release I thought it would make sense to create a few blog posts which would help others getting the Advanced Threat Prevention capabilities up and running.

I will be doing a few blog posts covering the deployment of

  • VMware NSX Application Platform
  • VMware NSX® Intelligence™
  • VMware NSX® Network Detection and Response™
  • VMware NSX® Malware Prevention
  • VMware NSX® Metrics

Stay virtual!

vRealize Network Insight 6.1

vRealize Network Insight 6.1 | 14 Jan 2021| Build 1610450081

vRealize Network Insight helps you build an optimized, highly available and secure network infrastructure across hybrid and multi-cloud environments. It provides network visibility and analytics to accelerate micro-segmentation security, minimize risk during application migration, optimize network performance and confidently manage and scale NSX, SD-WAN Velocloud, and Kubernetes deployments.

What’s New

vRealize Network Insight 6.1 and vRealize Network Insight Cloud (SaaS) deliver the latest in application and network visibility and analytics.

  • Customization: Pinboards to customize persistent dashboards
  • Multi-Cloud: Enhancements to visibility with VMware Cloud on AWS for traffic and dropped packets across gateway AWS Direct Connect, cross VPC, and public interface metrics
  • Assurance and Verification: Enhancements with in-context device configuration snapshots viewable from the topology map for easier troubleshooting
  • NSX-T: Data integration from NSX Intelligence can now be integrated for more application-centric network operations and troubleshooting visibility
  • VMware SD-WAN: New capabilities with analytics intent for better service-level agreement (SLA) monitoring and visibility with SD-WAN link utilization and metering

My Highlights

  • Integration with NSX-T Intelligence – I think vRNI does a fantastic job correlating all the data it ingests and now adding Intelligence as a data source will improve the visibility even more. When integration with NSX Intelligence is enabled, the flow record in vRealize Network Insight will now also display the Layer 7 service.
  • Intent Based improvements continue to show more and more value to users – I will definitely be testing the new Edge Uplink Utilization visibility.

Network Assurance and Verification

Layer 7 Service Information from NSX Intelligence

NSX-T Monitoring and Troubleshooting

VMware Cloud on AWS (VMC on AWS) 

  • Support for VMC T0 Router Interface Statistics which includes Rx Total Bytes, Rx Total Packets, Rx Dropped Packets, Tx Total Bytes, Tx Total Packets and Tx Dropped Packets for Public, Cross-VPC, and Direct Connect interfaces.

Physical Device Monitoring and Troubleshooting

  • Provides metric charts for better visualization and interaction with the metrics.

Search

  • Provides alternative search suggestions when a search fails to show results.

Pinboard

  • Preserves filter state when pinning a widget to a pinboard
  • Ability to pin the no results search to a pinboard
  • Ability to see other users’ pinboards in the Auditor role.

Alerts

  • Shows different alert definitions in separate tabs for easy classification and better management of alerts. Alert Definition (known as events in earlier release) refers to a problem or a change condition that the system detects
  • Introduces the term alert to indicate an instance when the system detects a problem, a change, or violation of an intent.

vRealize Network Insight Platform

  • Supports web proxies for data sources (SD-WAN, AWS, Azure, ServiceNow, and VMC NSX Manager)
  • Shows information related to Platform and Collector VMs such as IP address (name), last activity, status, and so on in one single page
  • Introduces the following new pages and capabilities:
    • Adding or updating data sources 
    • Web proxies listing page 
    • Web proxies usage visibility 
    • Infrastructure and support page.

Others

Source vRealize Network Insight 6.1 Release Notes

VMware NSX-T Data Center 3.1.1

VMware NSX-T Data Center 3.1.1   |  27 January 2021  |  Build 17483185

What’s New

NSX-T Data Center 3.1.1 provides a variety of new features to offer new functionalities for virtualized networking and security for private, public, and multi-clouds. Highlights include new features and enhancements in the following focus areas.

My Highlights
  • The introduction of OSPFv2 as the North/South Routing routing protocol – customers have been asking for this for sometime now but I think many customers have settled on eBGP by now but none the less I am sure this would still be handing for many customers.
  • NSX for vSphere is reaching end of support January 2022 and many customers are scrambling to migrate to NSX-T. The improvements in the latest version of the migration coordinator built into NSX-T now includes more supported current deployments e.g NSX for vSphere Cross vCenter deployments, vRA deployed blue prints, modular options selecting specific hosts and distributed Firewall policies.
  • NSX-T Advanced Server Load Balancer (AKA AVI Networks)
  • NSX-T Cloud – Option to deploy the NSX management plane and control plane fully in Azure.
  • NVDS to Converged VDS – Now introducing UI based migration option of Transport Nodes from NVDS to VDS with NSX-T. ***Note, only supported with VDS 7.0***
L3 Networking
  • OSPFv2 Support on Tier-0 Gateways
    • NSX-T Data Center now supports OSPF version 2 as a dynamic routing protocol between Tier-0 gateways and physical routers. OSPF can be enabled only on external interfaces and can all be in the same OSPF area (standard area or NSSA), even across multiple Edge Nodes. This simplifies migration from the existing NSX for vSphere deployment already using OSPF to NSX-T Data Center.
NSX Data Center for vSphere to NSX-T Data Center Migration
  • Support of Universal Objects Migration for a Single Site
    • You can migrate your NSX Data Center for vSphere environment deployed with a single NSX Manager in Primary mode (not secondary). As this is a single NSX deployment, the objects (local and universal) are migrated to local objects on a local NSX-T.  This feature does not support cross-vCenter environments with Primary and Secondary NSX Managers.
  • Migration of NSX-V Environment with vRealize Automation – Phase 2
    • The Migration Coordinator interacts with vRealize Automation (vRA) to migrate environments where vRealize Automation provides automation capabilities. This release adds additional topologies and use cases to those already supported in NSX-T 3.1.0.
  • Modular Migration for Hosts and Distributed Firewall
    • The NSX-T Migration Coordinator adds a new mode to migrate only the distributed firewall configuration and the hosts, leaving the logical topology(L3 topology, services) for you to complete. You can benefit from the in-place migration offered by the Migration Coordinator (hosts moved from NSX-V to NSX-T while going through maintenance mode, firewall states and memberships maintained, layer 2 extended between NSX for vSphere and NSX-T during migration) that lets you (or a third party automation) deploy the Tier-0/Tier-1 gateways and relative services, hence giving greater flexibility in terms of topologies. This feature is available from UI and API.
  • Modular Migration for Distributed Firewall available from UI
    •  The NSX-T user interface now exposes the Modular Migration of firewall rules. This feature was introduced in 3.1.0 (API only) and allows the migration of firewall configurations, memberships and state from an NSX Data Center for vSphere environment to an NSX-T Data Center environment. This feature simplifies lift-and-shift migration where you vMotion VMs between an environment with hosts with NSX for vSphere and another environment with hosts with NSX-T by migrating firewall rules and keeping states and memberships (hence maintaining security between VMs in the old environment and the new one).
  • Fully Validated Scenario for Lift and Shift Leveraging vMotion, Distributed Firewall Migration and L2 Extension with Bridging
    • This feature supports the complete scenario for migration between two parallel environments (lift and shift) leveraging NSX-T bridge to extend L2 between NSX for vSphere and NSX-T, the Modular Distributed Firewall.
Identity Firewall
Advanced Load Balancer Integration
  •  Support Policy API for Avi Configuration
  • Service Insertion Phase 2
    • This feature supports the Transparent LB in NSX-T advanced load balancer (Avi). Avi sends the load balanced traffic to the servers with the client’s IP as the source IP. This feature leverages service insertion to redirect the return traffic back to the service engine to provide transparent load balancing without requiring any server side modification.
Edge Platform and Services
  • DHCPv4 Relay on Service Interface
    • Tier-0 and Tier-1 Gateways support DHCPv4 Relay on Service Interfaces, enabling a 3rd party DHCP server to be located on a physical network
AAA and Platform Security
  • Guest Users – Local User accounts: NSX customers integrate their existing corporate identity store to onboard users for normal operations of NSX-T. However, there is an essential need for a limited set of local users — to aid identity and access management in many scenarios. Scenarios such as (1) the ability to bootstrap and operate NSX during early stages of deployment before identity sources are configured in non-administrative mode or (2) when there is failure of communication/access to corporate identity repository. In such cases, local users are effective in bringing NSX-T to normal operational status. Additionally, in certain scenarios such as (3) being able to manage NSX in a specific compliant-state catering to industry or federal regulations, use of local guest users are beneficial. To enable these use-cases and ease-of-operations, two guest local-users have been introduced in 3.1.1, in addition to existing admin and audit local users. With this feature, the NSX admin has extended privileges to manage the lifecycle of the users (e.g., Password rotation, etc.) including the ability to customize and assign appropriate RBAC permissions. Please note that the local user capability is available on both NSX-T Local Managers (LM) and Global Managers (GM) but is unavailable on edge nodes in 3.1.1 via API and UI. The guest users are disabled by default and have to be explicitly activated for consumption and can be disabled at any time. 
     
  • FIPS Compliant Bouncy Castle Upgrade: NSX-T 3.1.1 contains an updated version of FIPS compliant Bouncy Castle (v1.0.2.1). Bouncy Castle module is a collection of Java based cryptographic libraries, functions, and APIs. Bouncy Castle module is used extensively on NSX-T Manager. The upgraded version resolves critical security bugs and facilitates compliant and secure operations of NSX-T. 
NSX Cloud
  • NSX Marketplace Appliance in Azure: Starting with NSX-T 3.1.1, you have the option to deploy the NSX management plane and control plane fully in Public Cloud (Azure only, for NSX-T 3.1.1. AWS will be supported in a future release). The NSX management/control plane components and NSX Cloud Public Cloud Gateway (PCG) are packaged as VHDs and made available in the Azure Marketplace. For a greenfield deployment in the public cloud, you also have the option to use a ‘one-click’ terraform script to perform the complete installation of NSX in Azure. 
  • NSX Cloud Service Manager HA: In the event that you deploy NSX management/control plane in the public cloud, NSX Cloud Service Manager (CSM) also has HA. PCG is already deployed in Active-Standby mode thereby enabling HA. 
  • NSX-Cloud for Horizon Cloud VDI enhancements: Starting with NSX-T 3.1.1, when using NSX Cloud to protect Horizon VDIs in Azure, you can install the NSX agent as part of the Horizon Agent installation in the VDIs. This feature also addresses one of the challenges with having multiple components ( VDIs, PCG, etc.) and their respective OS versions. Any version of the PCG can work with any version of the agent on the VM. In the event that there is an incompatibility, the incompatibility is displayed in the NSX Cloud Service Manager (CSM), leveraging the existing framework. 
Operations
  • UI-based Upgrade Readiness Tool for migration from NVDS to VDS with NSX-T Data Center
    • To migrate Transport Nodes from NVDS to VDS with NSX-T, you can use the Upgrade Readiness Tool present in the Getting Started wizard in the NSX Manager user interface. Use the tool to get recommended VDS with NSX configurations, create or edit the recommended VDS with NSX, and then automatically migrate the switch from NVDS to VDS with NSX while upgrading the ESX hosts to vSphere Hypervisor (ESXi) 7.0 U2.
Licensing
  • Enable VDS in all vSphere Editions for NSX-T Data Center Users: Starting with NSX-T 3.1.1, you can utilize VDS in all versions of vSphere. You are entitled to use an equivalent number of CPU licenses to use VDS. This feature ensures that you can instantiate VDS.
Container Networking and Security
  • This release supports a maximum scale of 50 Clusters (ESXi clusters) per vCenter enabled with vLCM, on clusters enabled for vSphere with Tanzu as documented at configmax.vmware.com
Federation
Compatibility and System Requirements

For compatibility and system requirements information, see the NSX-T Data Center Installation Guide.

API Deprecations and Behavior Changes

Retention Period of Unassigned Tags: In NSX-T 3.0.x, NSX Tags with 0 Virtual Machines assigned are automatically deleted by the system after five days. In NSX-T 3.1.0, the system task has been modified to run on a daily basis, cleaning up unassigned tags that are older than one day. There is no manual way to force delete unassigned tags.

Duplicate certificate extensions not allowed: Starting with NSX-T 3.1.1, NSX-T will reject x509 certificates with duplicate extensions (or fields) following RFC guidelines and industry best practices for secure certificate management. Please note this will not impact certificates that are already in use prior to upgrading to 3.1.1. Otherwise, checks will be enforced when NSX administrators attempt to replace existing certificates or install new certificates after NSX-T 3.1.1 has been deployed.

Sourced from VMware NSX-T Data Center 3.1.1 Release Notes

VMware HCX 4.0

VMware HCX 4.0.0 | 23 FEB 2021 | Build 17667890 (Connector), Build 17667891 (Cloud)

What is VMware HCX

VMware HCX delivers secure and seamless app mobility and infrastructure hybridity across vSphere 6.0 and later versions, both on-premises and in the cloud. HCX abstracts the distinct private or public vSphere resources and presents a Service Mesh as an end-to-end entity. The HCX Interconnect can then provide high-performance, secure, and optimized multi-site connectivity to achieve infrastructure hybridity and present multiple options for bi-directional virtual machine mobility with technologies that facilitate the modernization of legacy data centers.

For more information, see the VMware HCX User Guide in the VMware Documentation Center.

First Change in HCX 4.0

Starting with the HCX 4.0 release, software versioning adheres to X.Y.Z Semantic Versioning, where X is the major version, Y is the minor version, and Z is the maintenance version. For more information about HCX software support, lifecycles, and version skew policies, see VMware HCX Software Support and Version Skew Policy. This document includes HCX Support Policy for Vacating Legacy vSphere Environments.

For information regarding HCX interoperability, see VMware Product Interoperability Matrix.

Upgrading to 4.0 from HCX 3.5.3 R-Releases

Prior to Semantic Versioning, HCX 3.5.3 releases were identified as “R” releases, such as R147. Review the following information prior to upgrading from R-based releases to HCX 4.0: 

  • Upgrading to HCX 4.0 is supported only from the following HCX Service Updates: R147 and  R146.
  • HCX Service Update R146 is the oldest version suitable for upgrade. Customers are required to move to R146 or later to support upgrading to HCX 4.0. 
  • Assistance with upgrading from out-of-support releases will be on a best-effort basis.
  • VMware sends administrative messages to HCX systems that are running out of support and require upgrade. 

Note: 3.5.3/R146-R147 HCX Manager systems will display release code R148 as a prefix to the 4.0.0 version. This is a known condition during the transition. 4.0.x HCX Managers will not display the R release codes.

So What’s New in HCX 4.0

VMware HCX 4.0 is a major release that introduces new functionality and enhancements.

Some of my highlights, then followed by all the details from the release notes

  • NSX Security Tag Migration – HCX Can now migrate NSX security tags associated to a virtual machine living in NSX for vSphere or NSX-T environments. This release does not migrate the security policies but only the security tags associated to the VM.
  • Usability – In-Service upgrade for Network Extension appliances, New event logs, estimated migration time metrics, Network Extension Metrics.
  • Improvements in OS assisted Migrations

Migration Enhancements

  • Mobility Migration Events  – The HCX Migration interface displays detailed event information with time lapse of events from the start of the migration operation. This information can help with understanding the migration process and diagnosing migration issues. See Viewing HCX Migration Event Details.
  • NSX Security Tag Migration – Transfers any NSX Security tags associated with the source virtual machine when selected as an Extended Option for vSphere to vSphere migrations. See Additional Migration Settings
  • Real-time Estimation of Bulk Migration – HCX analyzes migration metrics and provides an estimation of the time required to complete the transfer phase for every configured Bulk migration. The estimate is shown in the progress bar displayed on the Migration Tracking and Migration Management pages for each virtual machine migration while the transfer is in underway. For more information, see Monitoring Migration Progress for Mobility Groups.
     
  • OS Assisted Migration Scaling – HCX now supports 200 concurrent VM disk migrations across a four Service Mesh scale out deployment. A single Service Mesh deploys one Sentinel Gateway (SGW) and its peer Sentinel Data Receiver (SDR), and continues to support up to 50 active replica disks each. In this Service Mesh scale out model for OSAM, the HCX Sentinel download operation is presented per Service Mesh. See OS Assisted Migration in Linux and Windows Environments.
     
  • Migrate Custom Attributes for vMotion  –  The option Migrate Custom Attributes is added to the Extended Options selections for vMotion migrations. 
     
  • Additional Disk Formats for Virtual Machines – For Bulk, vMotion, and RAV migration types, HCX now supports these additional disk formats: Thick Provisioned Eager Zeroed, Thick Provisioned Lazy Zeroed. 
     
  • Force Power-off for In-Progress Bulk Migrations – HCX now includes the option to Force Power-off in-progress Bulk migrations, including the later stages of migration. 

Network Extension Enhancements

  • In-Service Upgrade – The Network Extension appliance is a critical component of many HCX deployments, not only during migration but also after migration in a hybrid environment. In-Service upgrade is available for Network Extension upgrade or redeploy operations, and helps to minimize service downtime and disruptions to on-going L2 traffic. See In-Service Upgrade for Network Extension Appliances

    Note: This feature is currently available for Early Adoption (EA). The In-Service mode works to minimize traffic disruptions from the Network Extension upgrade or redeploy operation to only a few seconds or less. The actual time it takes to return to forwarding traffic depends on the overall deployment environment.
  • Network Extension Details – HCX provides connection statistics for each extended network associated with a specific Network Extension appliance. Statistics include bytes and packets received and transferred, bit rate and packet rate, and attached virtual machine MAC addresses for each extended network. See Viewing Network Extension Details.

Service Mesh Configuration Enhancements

  • HCX Traffic Type Selection in Network Profile – When setting up HCX Network Profiles, administrators can tag networks for a suggested HCX traffic type: Management, HCX Uplink, vSphere Replication, vMotion, or Sentinel Guest Network. These selections then appear in the Compute Profile wizard as suggestions of which networks to use in the configuration. See Creating a Network Profile.

Usability Enhancements

  • HCX now supports scheduling of migrations in DRAFT state directly from the Migration Management interface.(PR/2459044)
  • All widgets in the HCX Dashboard can be maximized to fit the browser window. (PR/2609007)
  • The topology diagram shown in the Compute Profile now reflects when a folder is selected as the HCX Deployment Resource. (PR/2518674)
     
  • In the Create/Edit Network Profile wizard, the IP Pool/Range entries are visually grouped for readability. (PR/2456501)

Source VMware HCX 4.0 Release Notes

NSX-T Time-Based Firewall Policy

VMware NSX-T Distributed Firewall (DFW) offers L2 to L7 stateful firewall capabilities, in my previous blog I covered the capability to create policies matching FQDN/URLs. This blog will further expand on the NSX-T DFW capabilities and focus on time-based firewall policies.

With time-Based firewall policies, security administrators can restrict traffic from a source to a destination for a configured time period. This could be to restrict access to certain resources during specific hours.

Time windows apply to a firewall policy section, and all the rules in it. Each firewall policy section can have one time window. The same time window can be applied to more than one policy section. If you want the same rule applied on different days or different times for different sites, you must create more than one policy section. Time-based rules are available for distributed and gateway firewalls on both ESXi and KVM hosts.

This demonstration and blog is based on NSX-T 3.1.1

Prerequisites

As per the VMware documentation, the following needs to be in place:

Network Time Protocol (NTP) is an Internet protocol used for clock synchronization between computer clients and servers. NTP service must be running on each transport node when using time-based rule publishing.

If a time-zone is changed on the edge transport node after the node is deployed, reload the edge node or restart the data plane for time-based gateway firewall policy to take effect

It is highly recommended to enable NTP on network and security appliances in your environment, this is really helpful for troubleshooting and monitoring purposes.

At the time of creating this blog, Time-Based policies are only supported with NSX-T appliances configured with the timezone set to UTC.

Getting Started

I will start with configuring NTP on my NSX-T setup to confirm that the prerequisites are in place and then cover enabling Time-Based policies.

Configuring NTP on Appliance and Transport Nodes

Configure NTP on an appliance

Some system configuration tasks must be done using the command line or API. We will do the needed from the NSX-T CLI. The following commands should be configured on the NSX-T Manager appliance and the NSX-T Edge appliances

  • Set system timezone set timezone <timezone>
  • Set NTP Server set ntp-server <ntp-server>
  • Set a DNS server set name-servers <dns-server>
  • Set DNS Search Domain set search-domains <domain>

Open a terminal and ssh to the management IP/Virtual IP of the NSX-T Manager and/or the NSX-T Edge devices as admin. In my lab the NTP and DNS service is running on 192.168.10.9

  • nsx-dc-01> set timezone UTC
  • nsx-dc-01> set ntp-server 192.168.10.9
  • nsx-dc-01> set name-servers 192.168.10.9
  • nsx-dc-01> set search-domains vmwdxb.com

After doing these configurations on the NSX-T Manager and NSX-T Edge(s) Nodes, the time should match the time of day on the NTP source. The NSX-T Edge appliance will use its management IP address as the source of the NTP/DNS lookup so confirm you have network connectivity from these interfaces to the NTP/DNS and open any firewalls if needed. NTP uses UDP port 123.

***If you are changing the timezone on the edge devices, you will need to restart the service data plane or reload the edge appliance***. “restart service dataplane”

Alternatively the NSX-T Manager UI also allows NTP configurations to be applied to all nodes using the Node Profile under the Fabric configurations.

NTP Configuration using Node Profile

To configure NTP for an ESXi host, see the topic Synchronize ESXi Clocks with a Network Time Server, in vSphere Security or if your hosts are managed by vCenter.

Confirm that the ESXi hosts are synchronised with NTP using ntpq -pn from the CLI – confirm that there is * next to the NTP server IP

Output from ESXI CLI
Configuring Time-Based Security Policy

Create a firewall policy or edit an existing policy. I pre-configured a policy section with one DFW rule allowing two desktops access to anything. From the steps below I will be enabling the Time-Based Firewall on the Time-Based-Policy DFW section.

  • (Step 1) Click the clock icon on the firewall policy you want to have a time window.
Time Icon is to the right of the policy

A time window appears

NSX-T Time Window
  • (Step 2) Click Add New Time Window and enter a name
  • (Step 3) Select a time zone: UTC (Coordinated Universal Time), or the local time of the transport node. Distributed firewall only supports UTC with NTP service enabled, a change of time zone configuration is not supported
  • (Step 4) Select the frequency of the time window – Weekly or One time.
  • (Step 5) Select the days of the week that the time window takes effect.
    • NSX-T Data Center supports configuring weekly UTC time-windows for the local time-zone, when the entire time-window for the local time-zone is within the same day as the UTC time-zone. For example, you cannot configure a time window in UTC for a 7am-7pm PDT, which maps to UTC 2pm-2am of the next day.
  • (Step 6) Select the beginning and ending dates for the time window, and the times the window will be in effect.
Time Based Configuration
  • (Step 7) Click Save

In my demonstration I have selected the policy to be activate daily starting from the 1st of March 2021 until 1st of April 2021 and only be applied between 08:30 to 09:00 in the morning.

***Take note the minimum configurable time range is 30 minutes and only supported in 30min blocks.***

(Step 8) Click the check box next to the policy section you want to have a time window. Then click the clock icon.

Click the radio button on the top left next to Time Window configured
  • (Step 9) Select the time window you want to apply, and click Apply.
  • (Step 10) Click Publish, The clock icon for the section turns green.
Published Policy

When publishing the policies, NSX-T Manager will check and confirm that NTP is correctly configured and running on transport nodes before the Time-Window is successfully applied. The Clock turns green when successfully applied. If you click on Success in the Firewall Section you can see the transport hosts where this policy has been pushed too successfully.

Time-Based DFW Section applied to the ESXi Transport Nodes

For the first publication of a time-based rule, the time is taken, and rule enforcement begins at less than 2 minutes. After the rules are deployed, enforcement as per time window, is instantaneous.

Outside of the time window configured NSX-T was preventing access to the Internet for my demo desktop.

Outside of the permitted time window configured

As the clocked changed to open window, I refreshed the page and successfully loaded the page.

Access to http://www.vmware.com

From LogInsight you can see that it is indeed my DFW rule number 3054 allowing the access.

LogInsight Output
Some side notes

When I published the DFW policy changes the first time an error occurred and the NSX-T manager reported that my transport nodes (ESXi hosts) did not have a valid NTP Service running.

NSX-T fails to publish the Time Based Policy

Although I had NTP configured on ESXi hosts pointing to a Win2012 server in my lab, NTP was not actually synchronising with the Win2012 server. So I switched all my ESXi nodes and NSX-T nodes to point to a Ubuntu virtual machine which I configured as a NTP Server too and this resolved error above.

NTP Not Synchronised on ESXi host with Win2012

You can see from the screenshot above, there is no * next to the IP 192.168.10.5

Working NTP Synchronisation

Thanks for the taking time to read this blog, hopefully you found it useful. It definitely helped me get a better understanding of making use of this feature.

NSX-T Filtering Specific Domains (FQDN/URLs)

VMware NSX-T Distributed Firewall (DFW) offers L2 to L7 stateful firewall capabilities. Most NSX-T operators are fairly comfortable creating L4 policies in the quest to achieve the “zero-trust” model.

In this blog I wanted to take this one step further and explore the capabilities of using the DFW to enforce policy matching L7 FQDN/URLs. I will demonstrate how to go about using some builtin FQDN’s and adding a custom FQDN’s to create security policies restricting outbound access from virtual workloads attached to NSX-T overlay networks.

A fully qualified domain name (FQDN) is the complete domain name for a specific host on the Internet. FQDNs are used in firewall rules to allow or reject traffic going to specific domains.

NSX-T Data Center supports custom FQDNs that are defined by an administrator on top of an existing pre-defined list of FQDNs.

This demonstration and blog is based on NSX-T 3.1.1

Prerequisites

As per the VMware documentation, the following needs to be in place:

You must set up a DNS rule first, and then the FQDN allowlist or denylist rule below it. This is because NSX-T Data Center uses DNS Snooping to obtain a mapping between the IP address and the FQDN. SpoofGuard should be enabled across the switch on all logical ports to protect against the risk of DNS spoofing attacks. A DNS spoofing attack is when a malicious VM can inject spoofed DNS responses to redirect traffic to malicious endpoints or bypass the firewall.

FQDN-based rules are retained during vMotion for ESXi hosts.

NOTE: ESXi and KVM hosts are supported. ESXi supports droplisting action for URL rules. KVM supports the allowlisting feature.

Custom FQDN supports the following

  • Full FQDN names such as maps.google.com or myapp.corp.com
  • Partial REGEX with * at the beginning only such as *eng.northpole.com or *yahoo.com
  • FQDN name length up to 64 characters
  • FQDN names should end with the registered Top Level Domain (TLD) such as .com, .org, or .net

Getting Started

  • (Step 1) From your browser, log in with admin privileges to an NSX Manager at https://
NSX-T Manager
  • (Step 2) Navigate to Security -> Distributed Firewall ->
NSX-T Distributed Firewall UI
  • (Step 3) Add a firewall policy section by following the steps in Add a Distributed Firewall. An existing firewall policy section can also be used.
Added Policy Section “FQDN Demo Policy”
  • (Step 4) Select the new or existing firewall policy section
  • (Step 5) Click Add Rule to create the DNS firewall rule first – I will create the firewall in the policy section created in step 3
    • Provide a Name for the rule – My example is using DNS Rule
    • Select the Services (DNS/UDP-DNS) – I included both for the purpose of the demo
    • Select the L7 Context Profile (DNS) – This is system generated context profile, and is available in your deployment by default.
    • Applied To – Select the group as required, I left it default at this stage.
    • Action – Select Allow
DNS Firewall Rule
  • (Step 6) Click Add Rule again to set up the FQDN allowlisting or denylisting rule
  • (Step 7) Name the rule appropriately, such as, FQDN/URL Allowlist. Drag the rule under the DNS rule under this policy section.
Second Firewall rule created “FQDN-RULE-01”

***Take note about dragging the newly created FQDN rule below the DNS Rule ***

  • (Step 8) Provide the following details
    • Services Click the edit icon and select the service you want to associate with this rule, for example, HTTP [I selected HTTP & HTTPS]
    • Context Profiles Click the edit icon, and Add Context Profile and name the profile. In the Attributes column, select Set > Add Attribute > Domain (FQDN) Name . Select the list of Attribute Name/Values from the predefined list, or create a custom FQDN
      • My Customer Context Profile is Named FQDN-Profile and I added the following builtin FQDN attributes to start my testing with:
Three FQDN attributes selected
  • Applied To Select DFW or a group as required.
    • Action Select Allow, Drop, or Reject.
      • I am going to set the action to drop to prevent access to three selected FQDN’s
  • (Step 9) Publish
FQDN Firewall

Demonstration

I am using virtual desktop connected my NSX-T environment and will be using the Chrome browser to access some websites to confirm if my policy created is prevent the access to the selected FQDN’s. I am going to start off with setting m FQDN policy to allow so that I can confirm the connectivity to itunes.apple.com does indeed work.

Next I am going to access itunes.apple.com to confirm connectivity

itunes.apple.com is re-written to apple.com/itunes/

Now I will set my security policy back to block and test this page again.

Deny DFW Rule

Now with the FQDN rule set to drop, my access to itunes.apple.com has been restricted by the NSX-T DFW

Testing http://itunes.apple.com

Just to make sure that the NSX-T DFW is actually dropping the data, I logged into my LogInsight Log server filtered to all dropped logs

LogInsight Dropping the FQDN Data

Custom FQDN Demo

So in the demonstration above I just used some of the built-in FQDN’s provided by NSX-T when installed, now I will create a custom FQDN of my choice and perform the testing again.

I am going to add another DFW firewall to my policy section named FQDN-Rule-02 – follow from step 6 but when you get to step 8, instead of selecting one of the out of the box FQDN’s in the context profile click on the three dots on the right hand side.

Context Profile Attributes

Once you clicked on those three dots and hit ADD FQDN, it opens the pop up shown below and you enter your custom FQDN/URL and click save.

Take Note: Enter the domain name in form *[hostname].[domain]

Custom FQDN Created

Now that you have selected your custom FQDN attribute click ADD and then Apply and save the Context Profile.

Then click Apply

Custom Context Profile

Once completed you will see the newly created DFW rule, I have set my rule to allow to confirm connectivity to you yogovirtual.com. Then I am going to change the action to drop.

DFW Section with both FQDN DFW Rules
Demonstrating accessing https://yogovirtual.com

I changed the policy to drop in the NSX-T DFW and closed the browser and opened the page again and confirmed that the access to the customer FQDN is blocked.

Access to Custom FQDN being blocked

I accessed my LogInsight to confirm the drop action taking place

LogInsight NSX-T DFW Logs

This concludes this blog post, I hope that it helps you understand how to enable FQDN based Filtering using the NSX-T DFW.